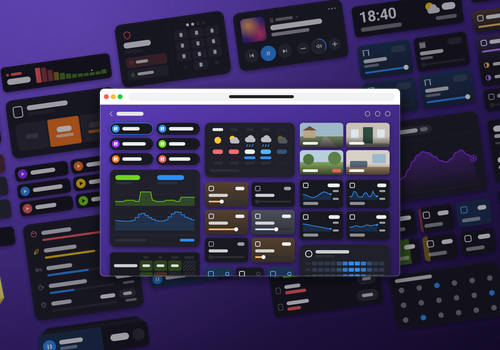

Widgetkeeper adds dashboard widgets that feel like part of Homey. Each one is designed to sit naturally alongside Homey's built-in widgets, with the same look and feel.
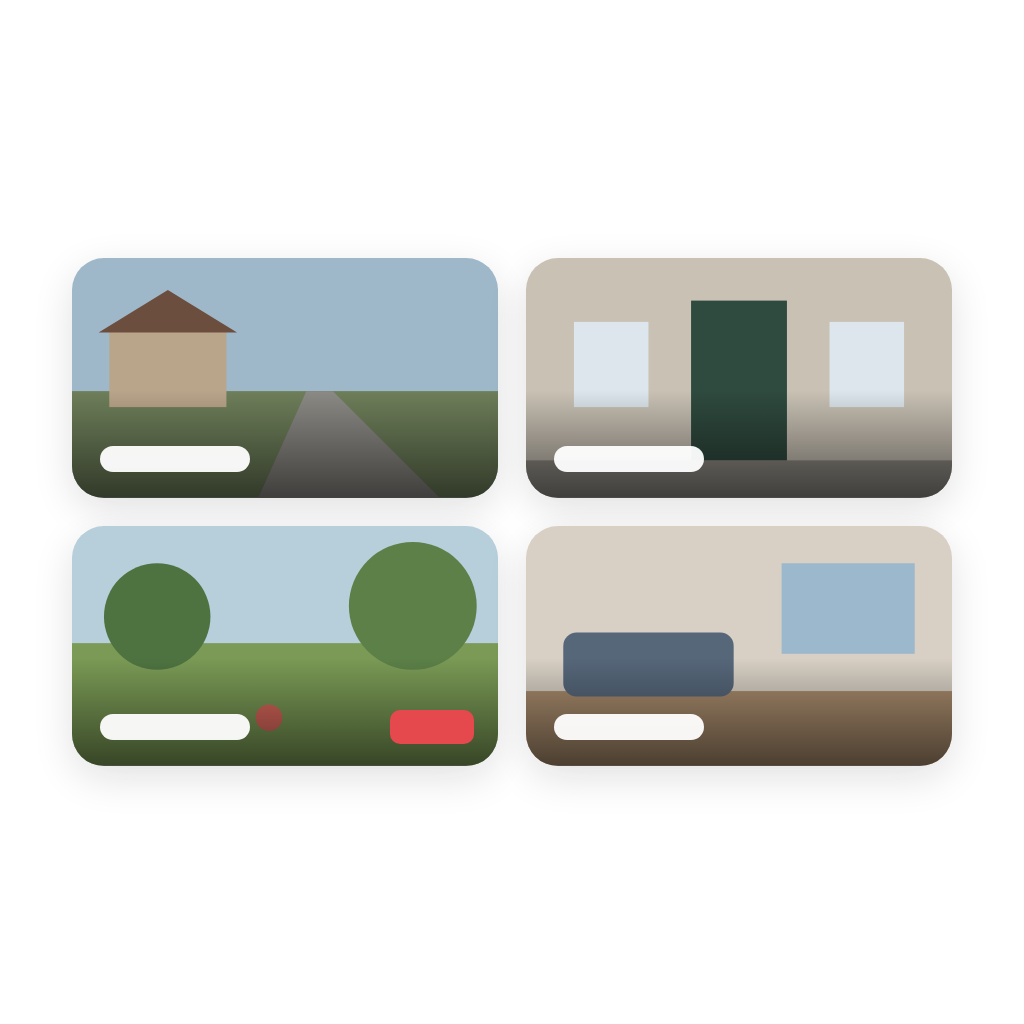
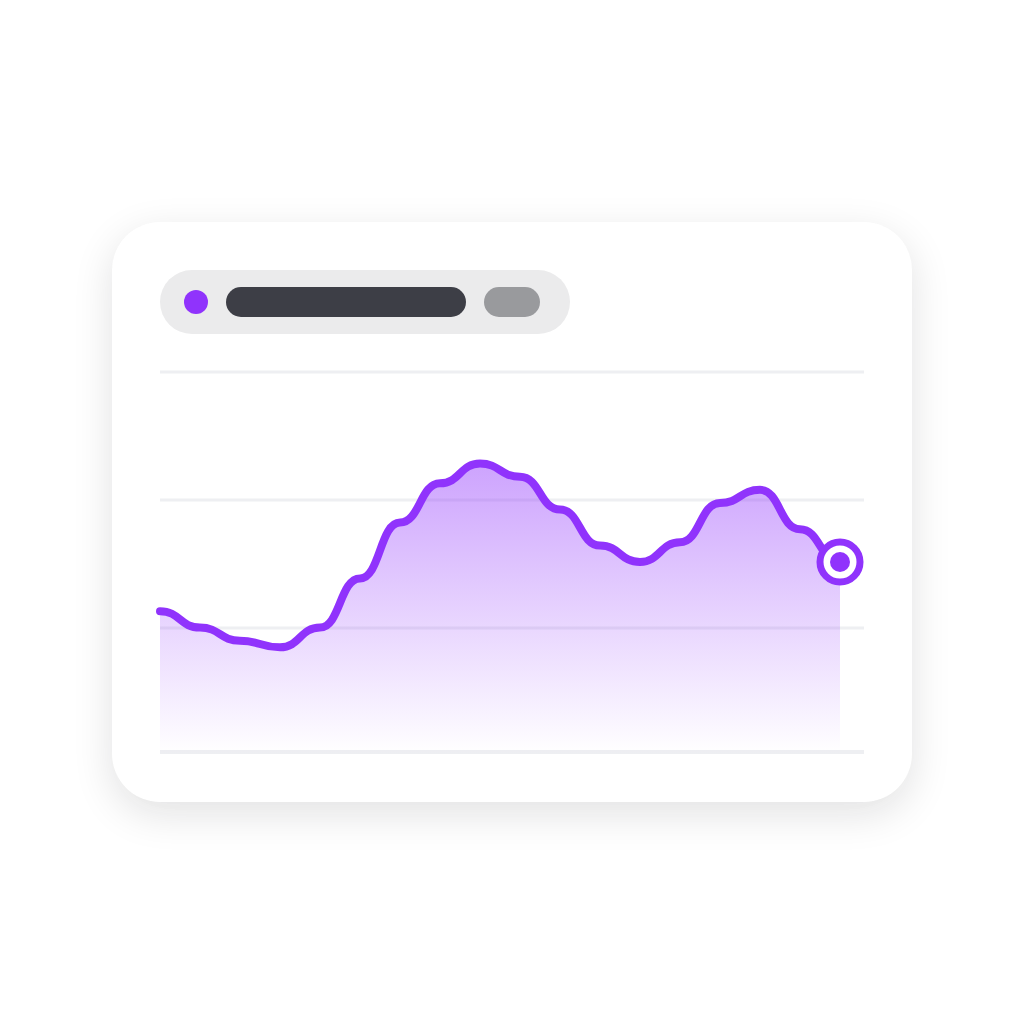
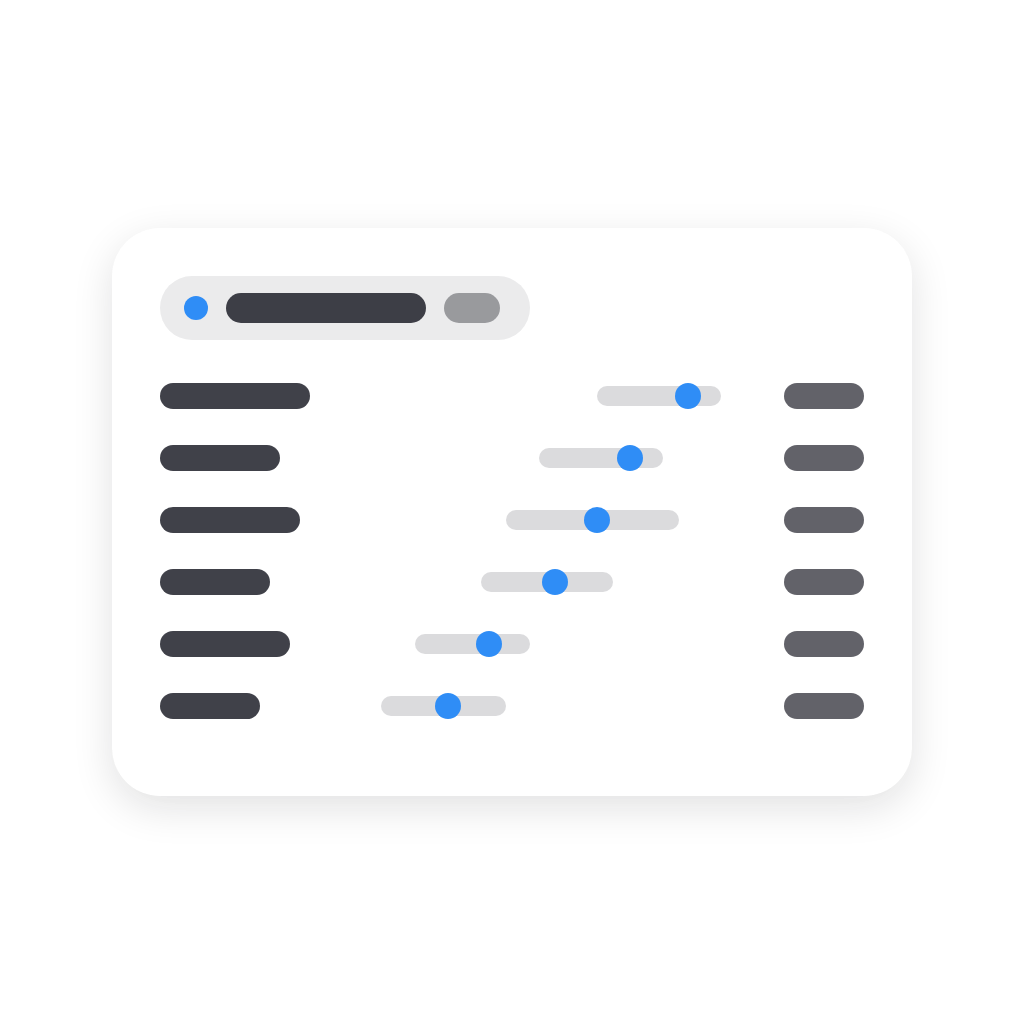
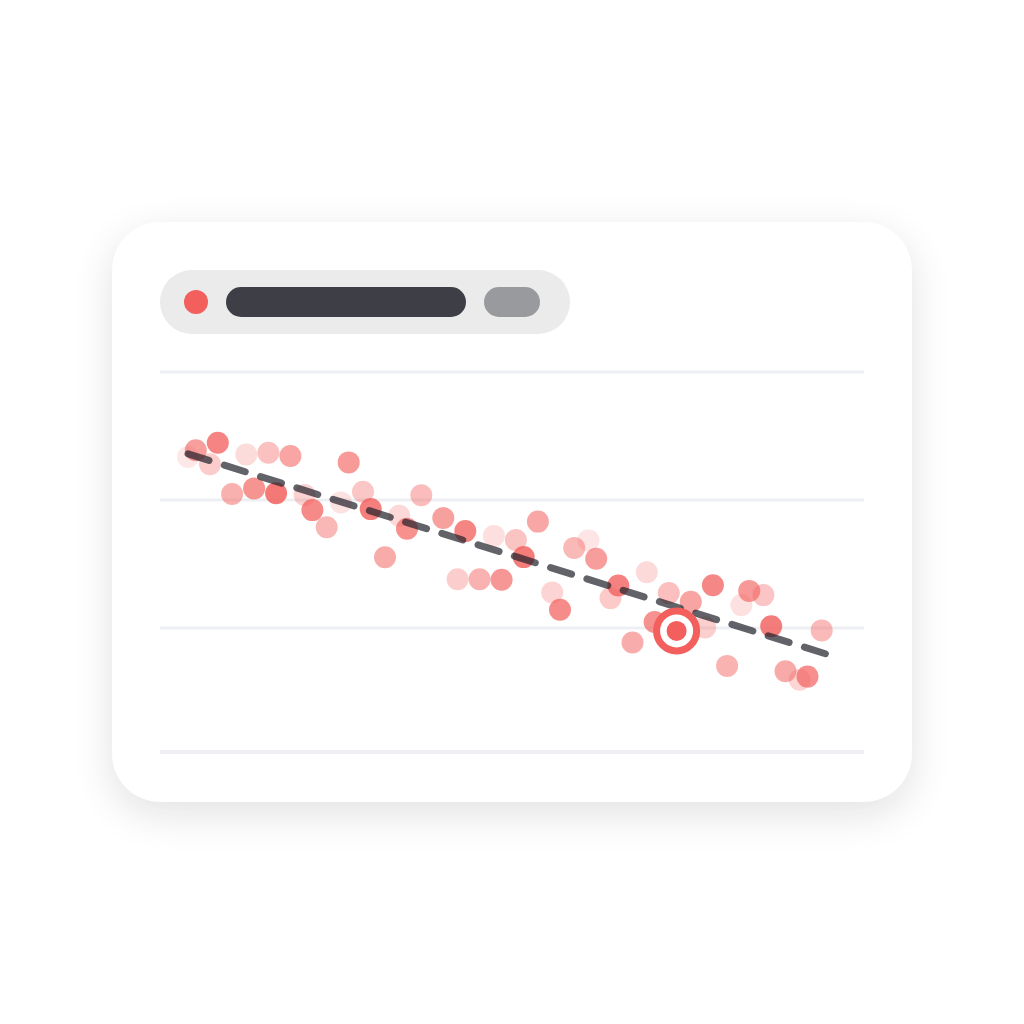
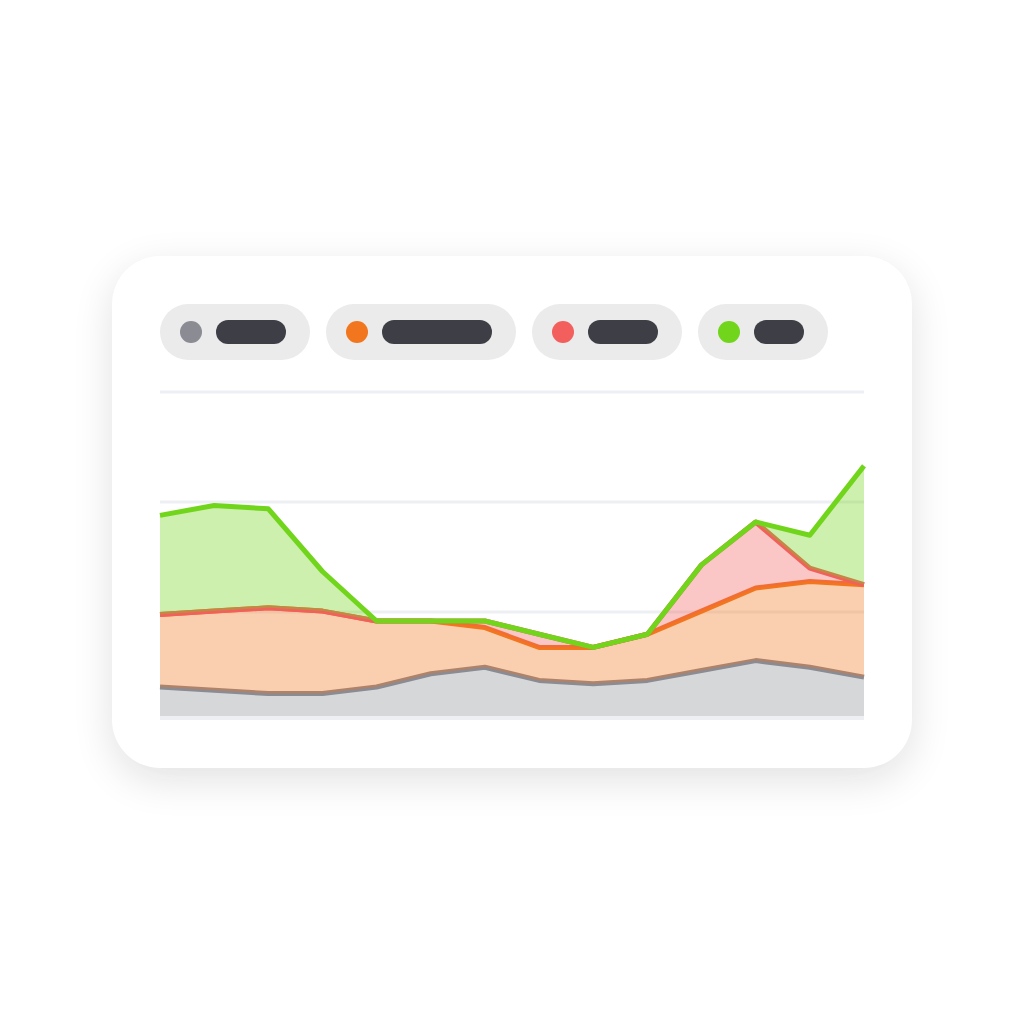
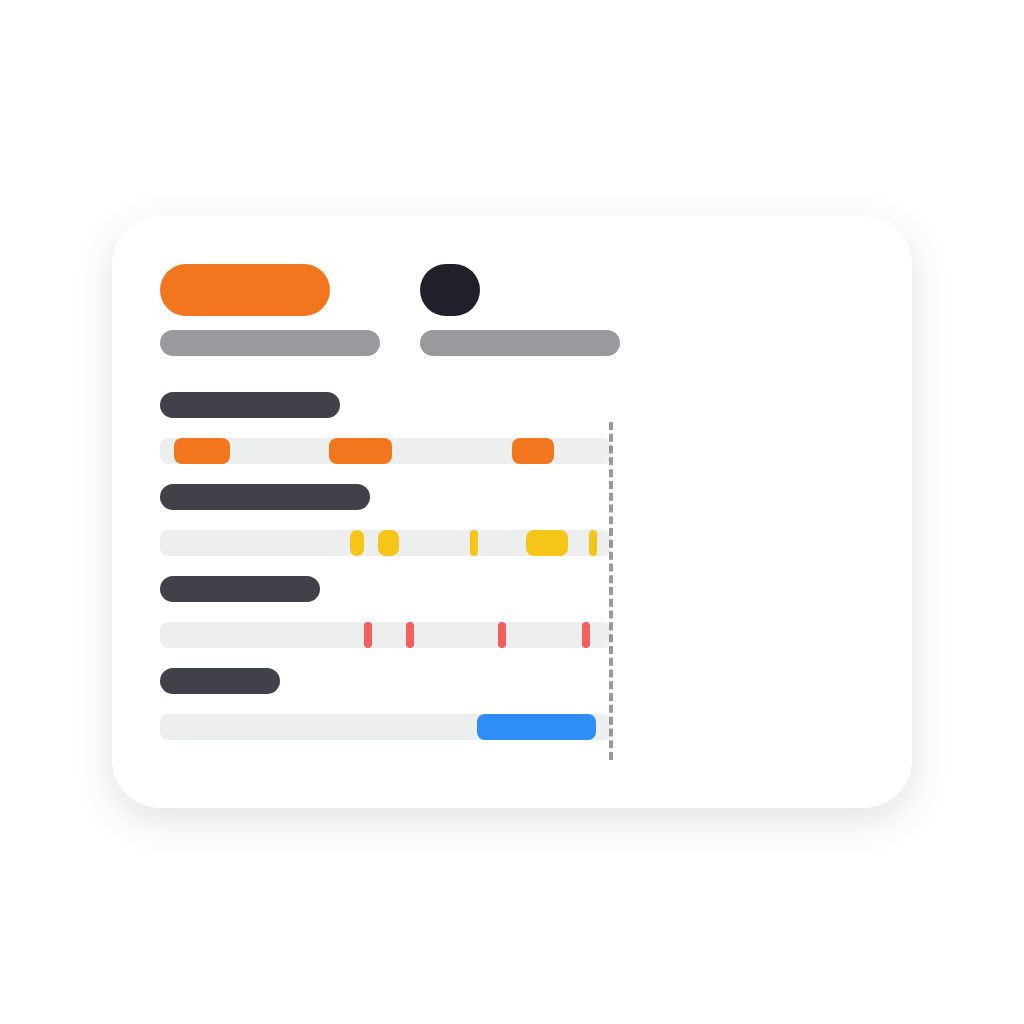
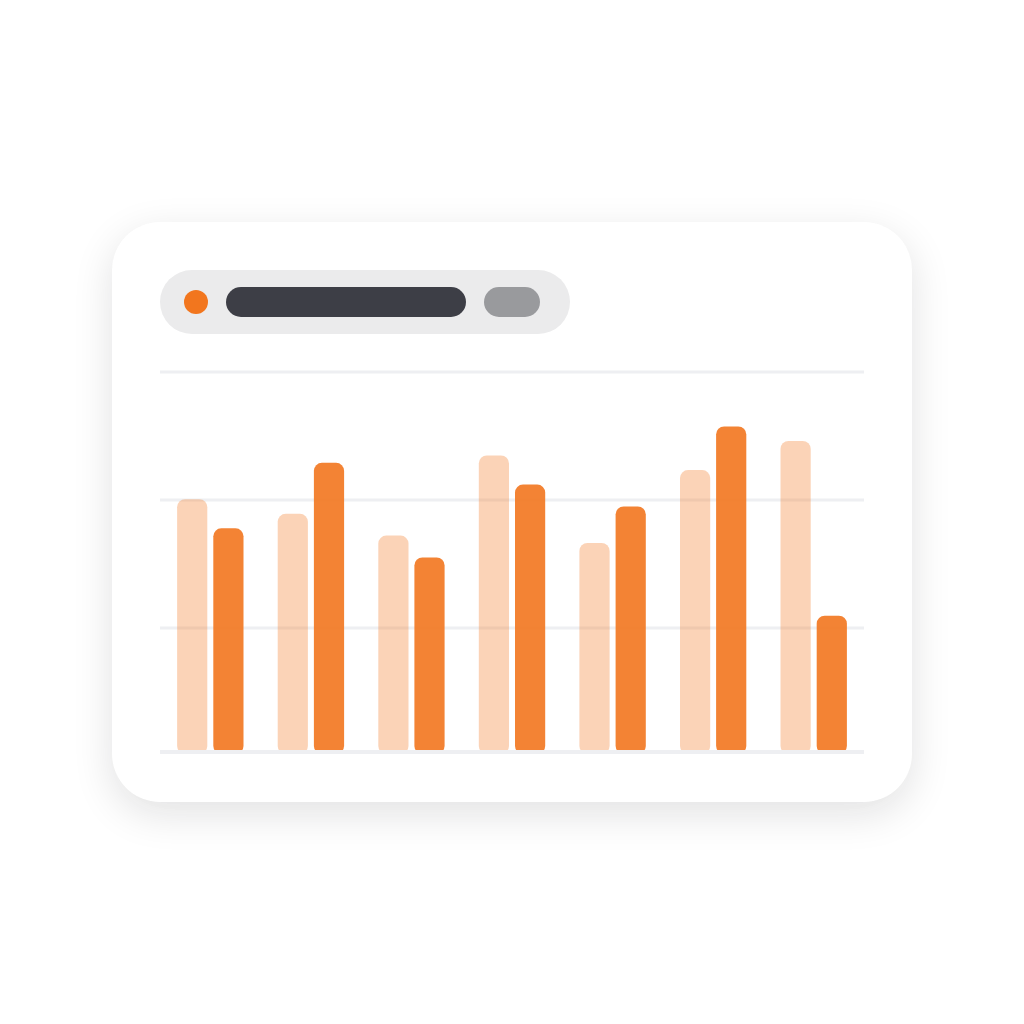
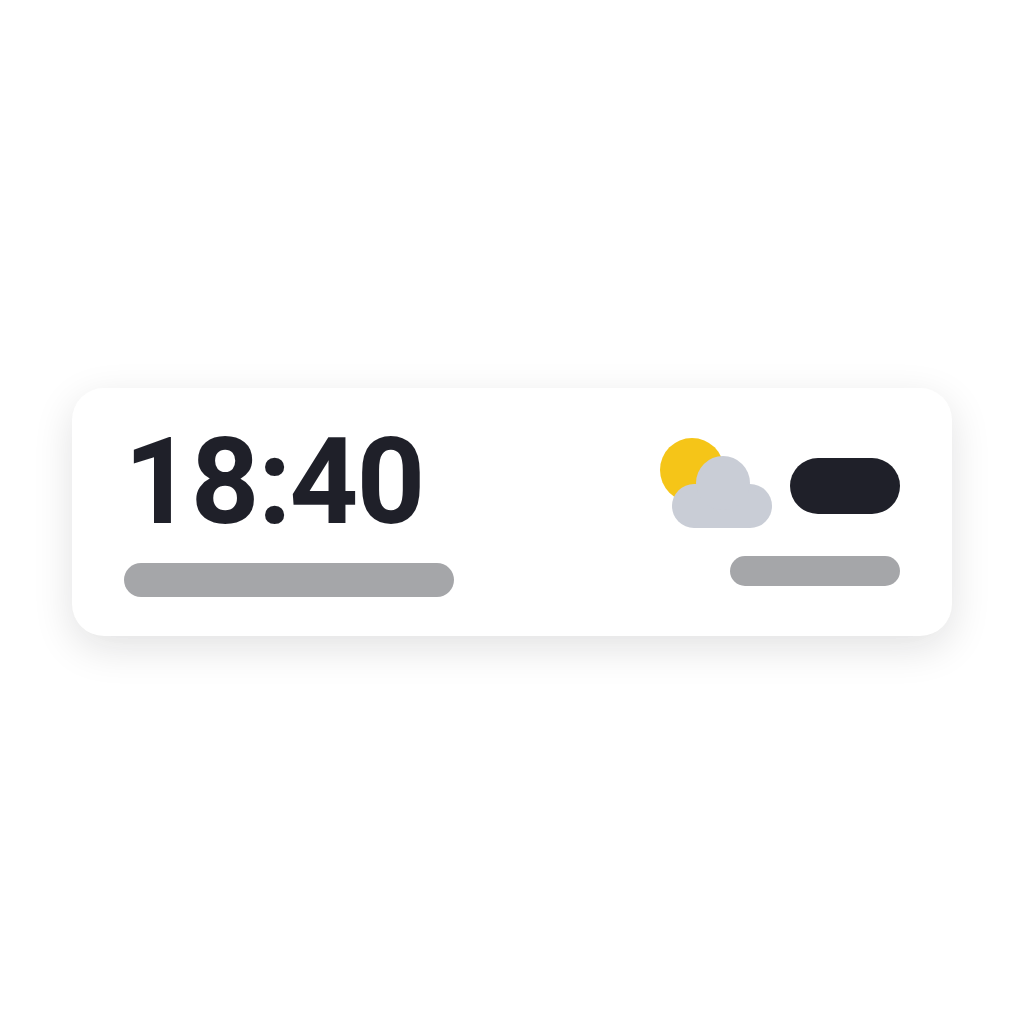
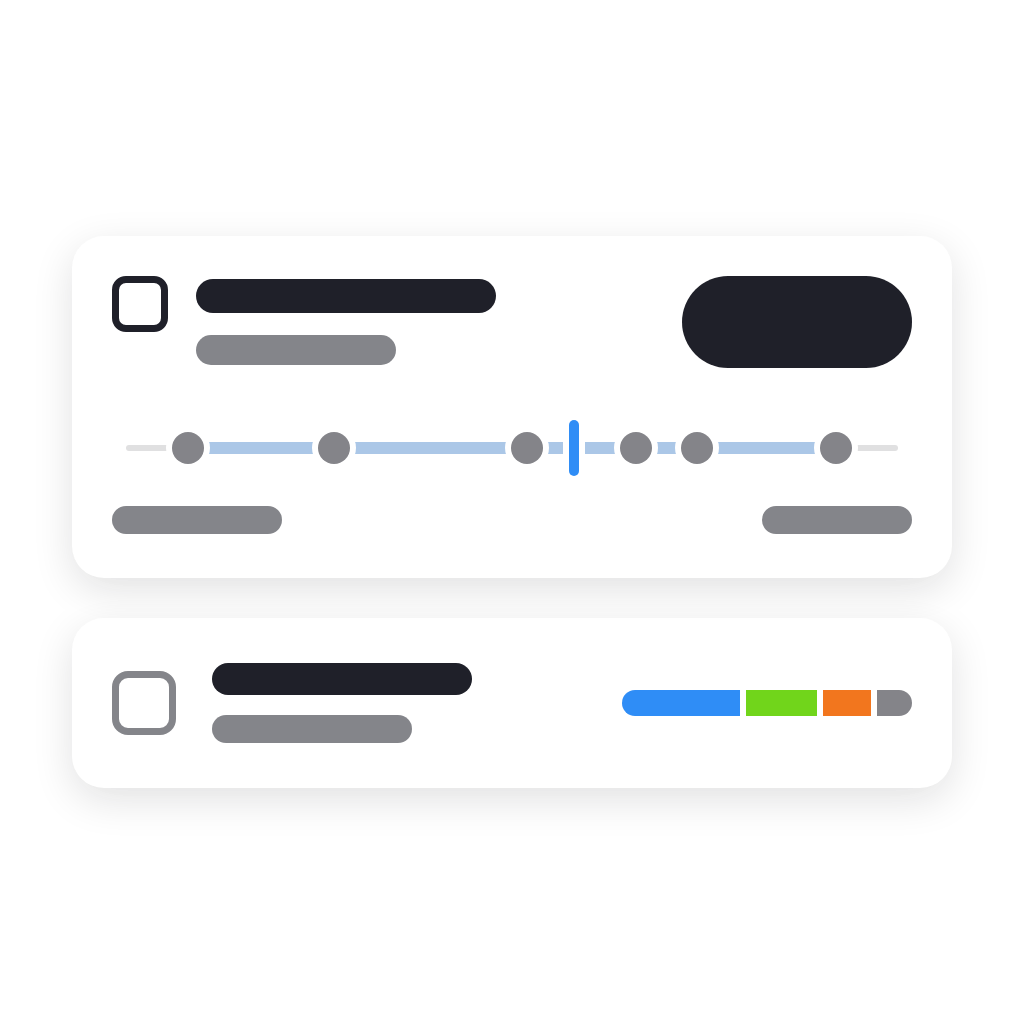
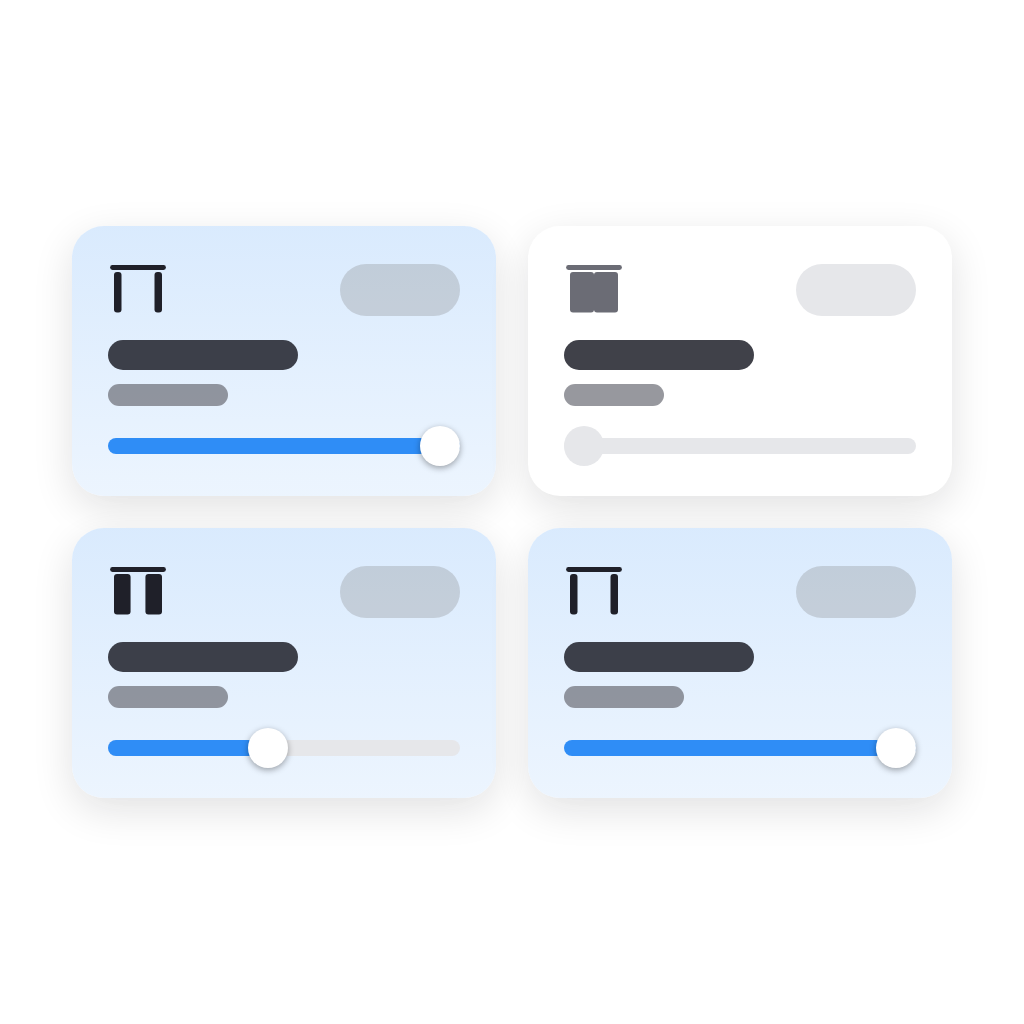
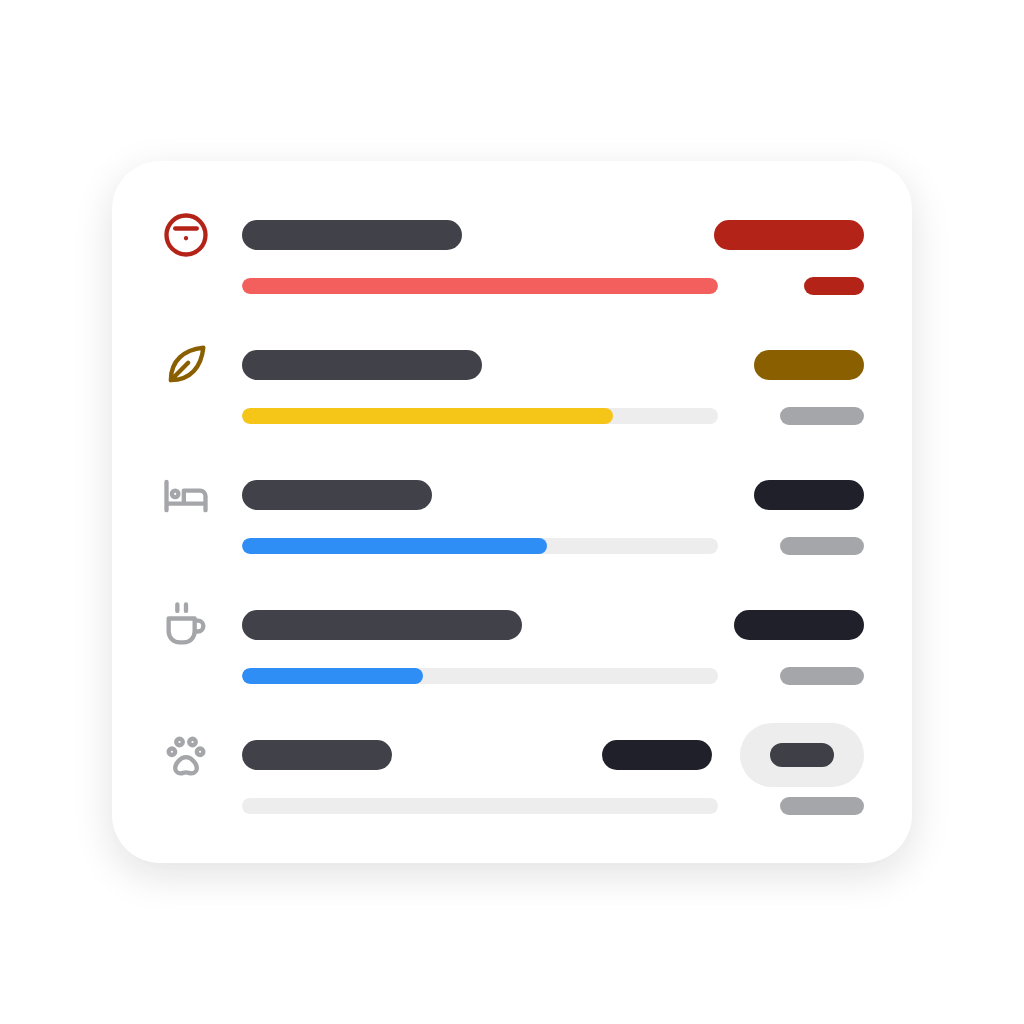
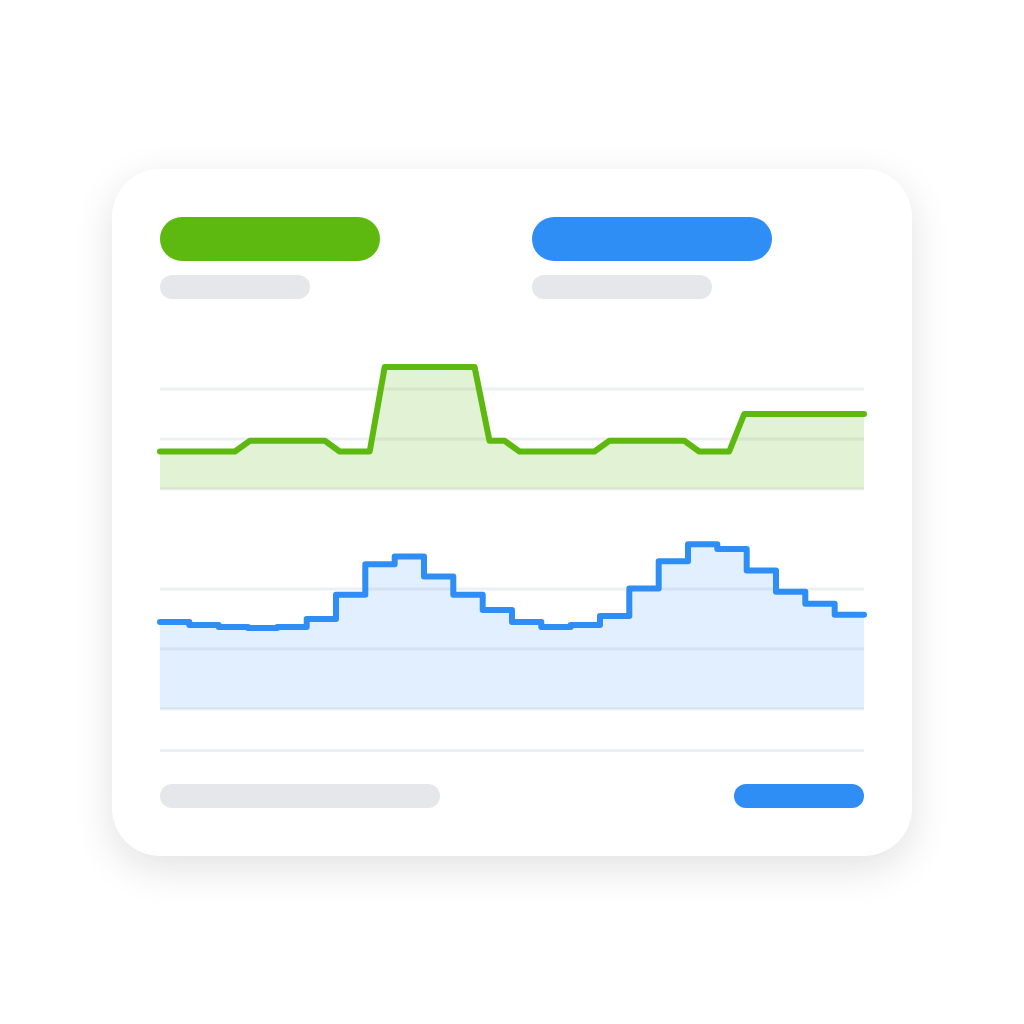
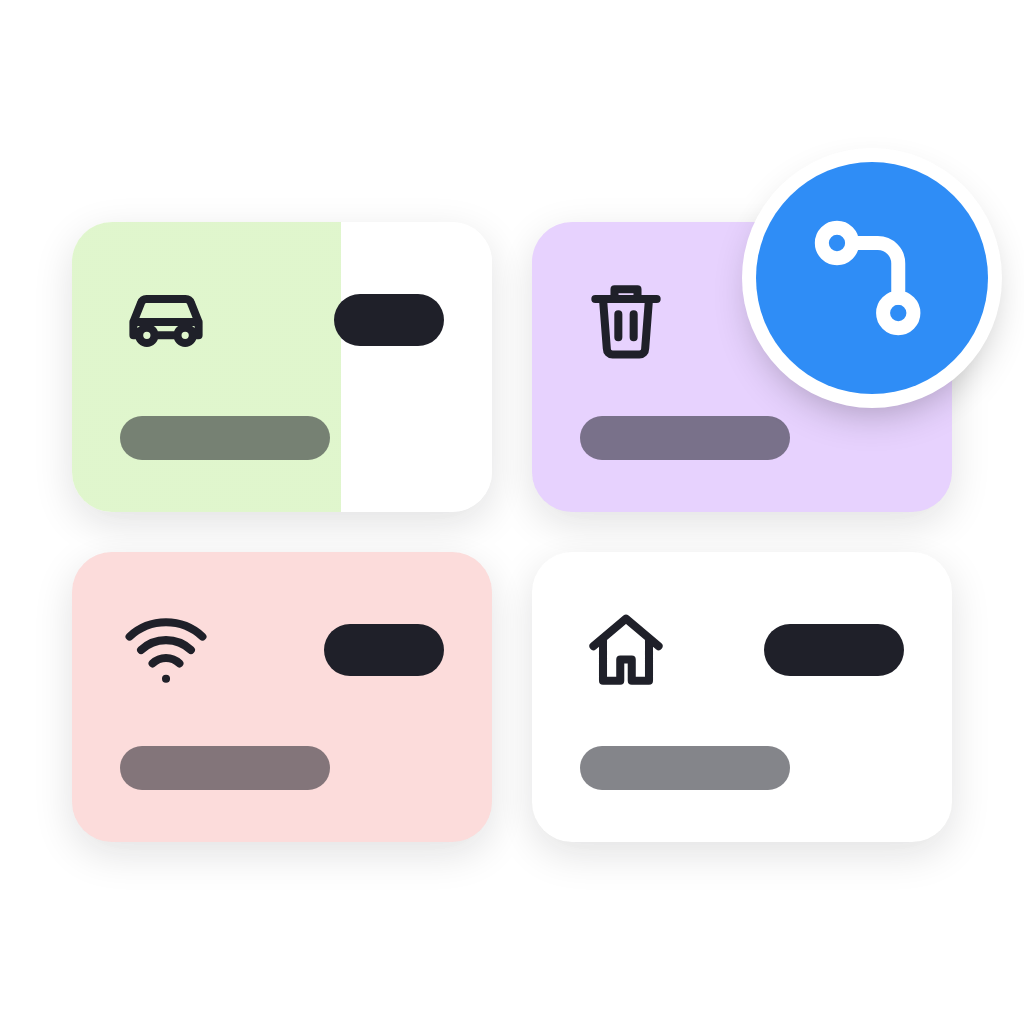
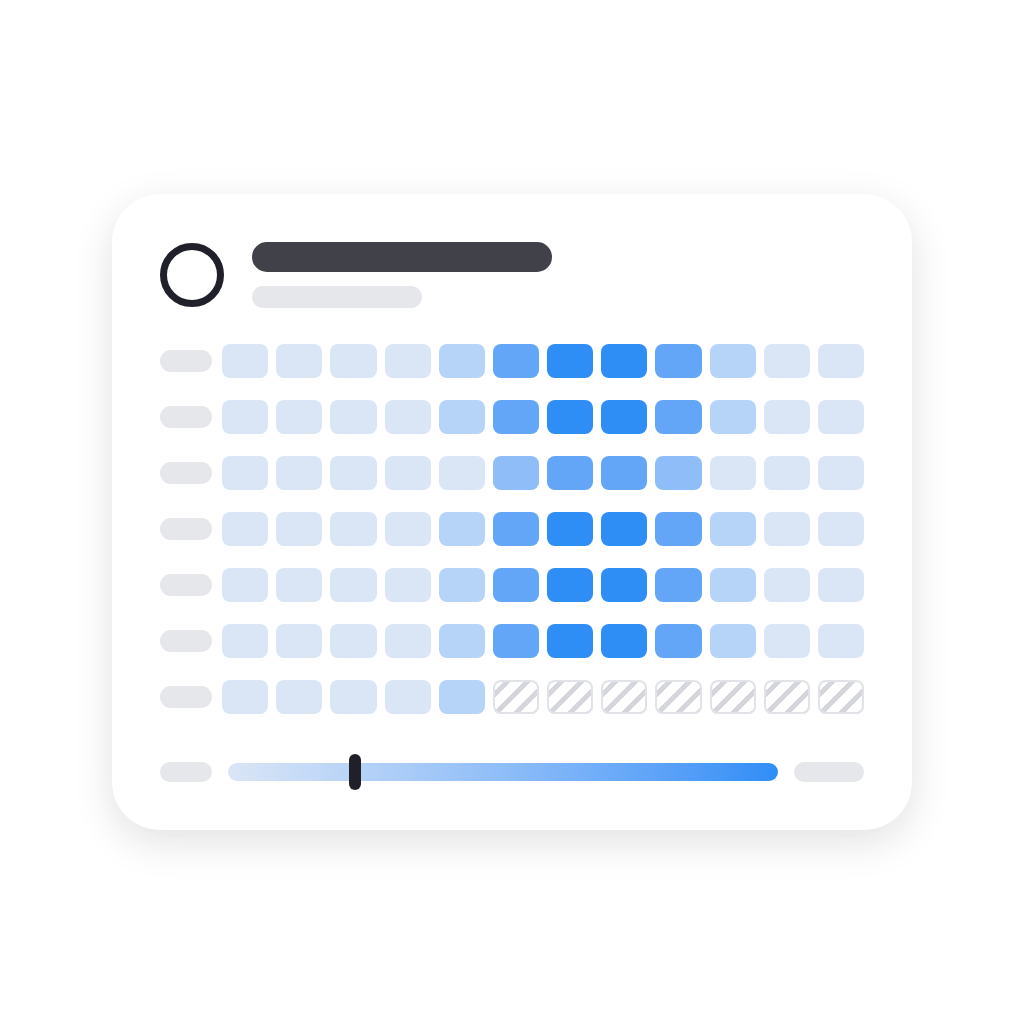
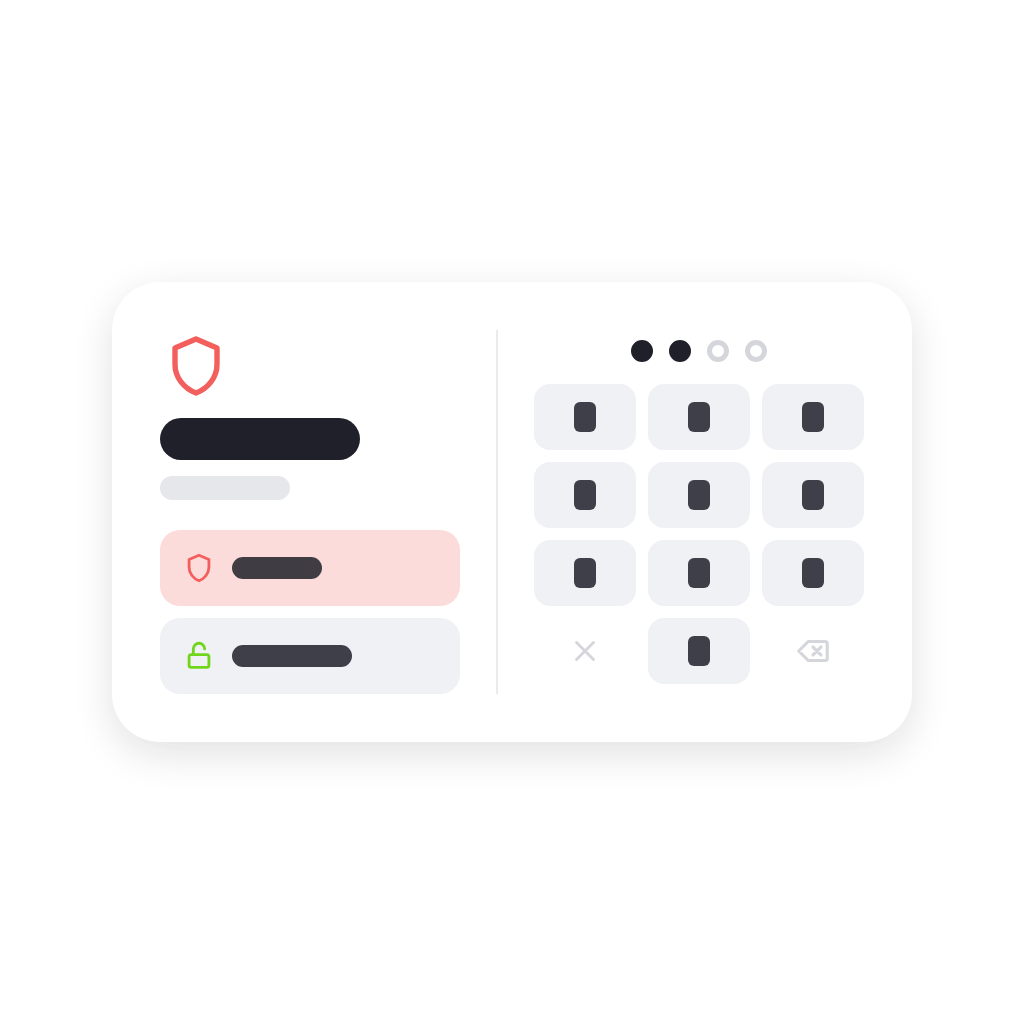
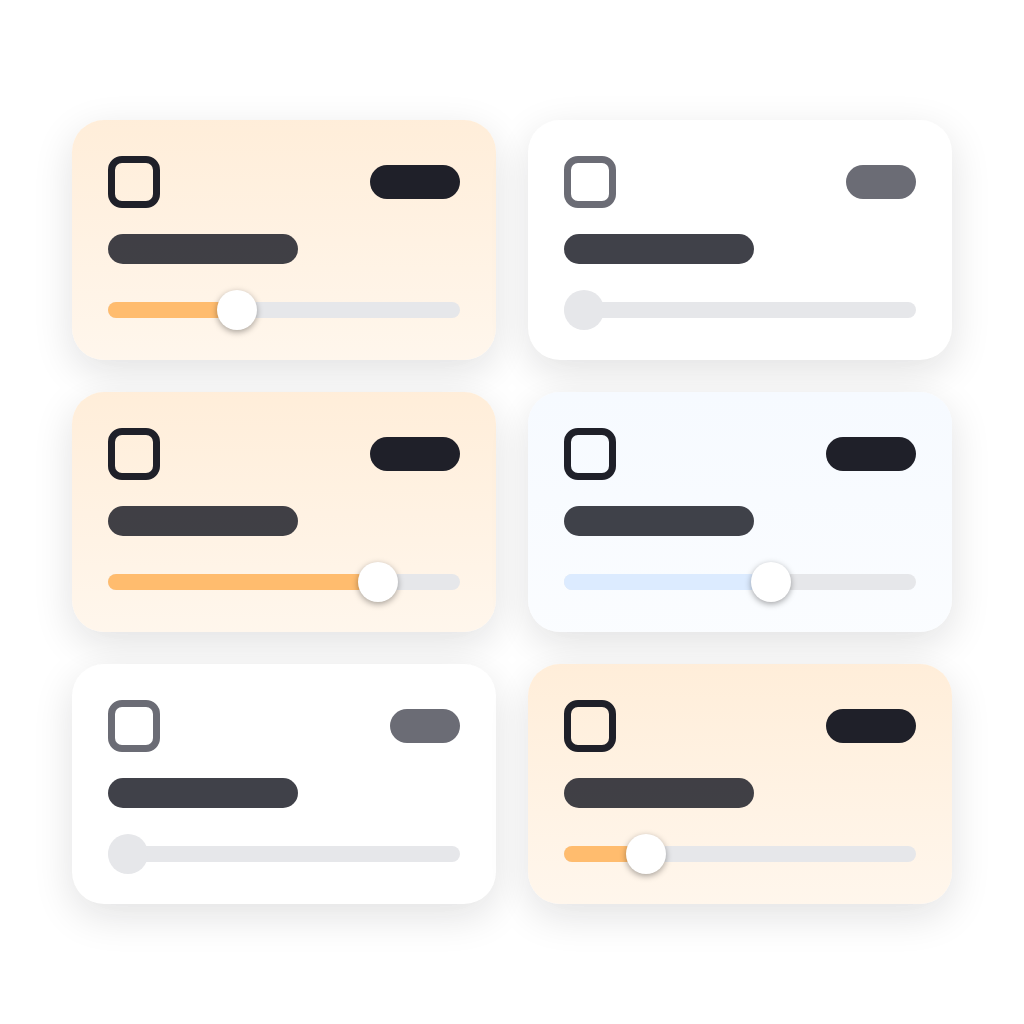
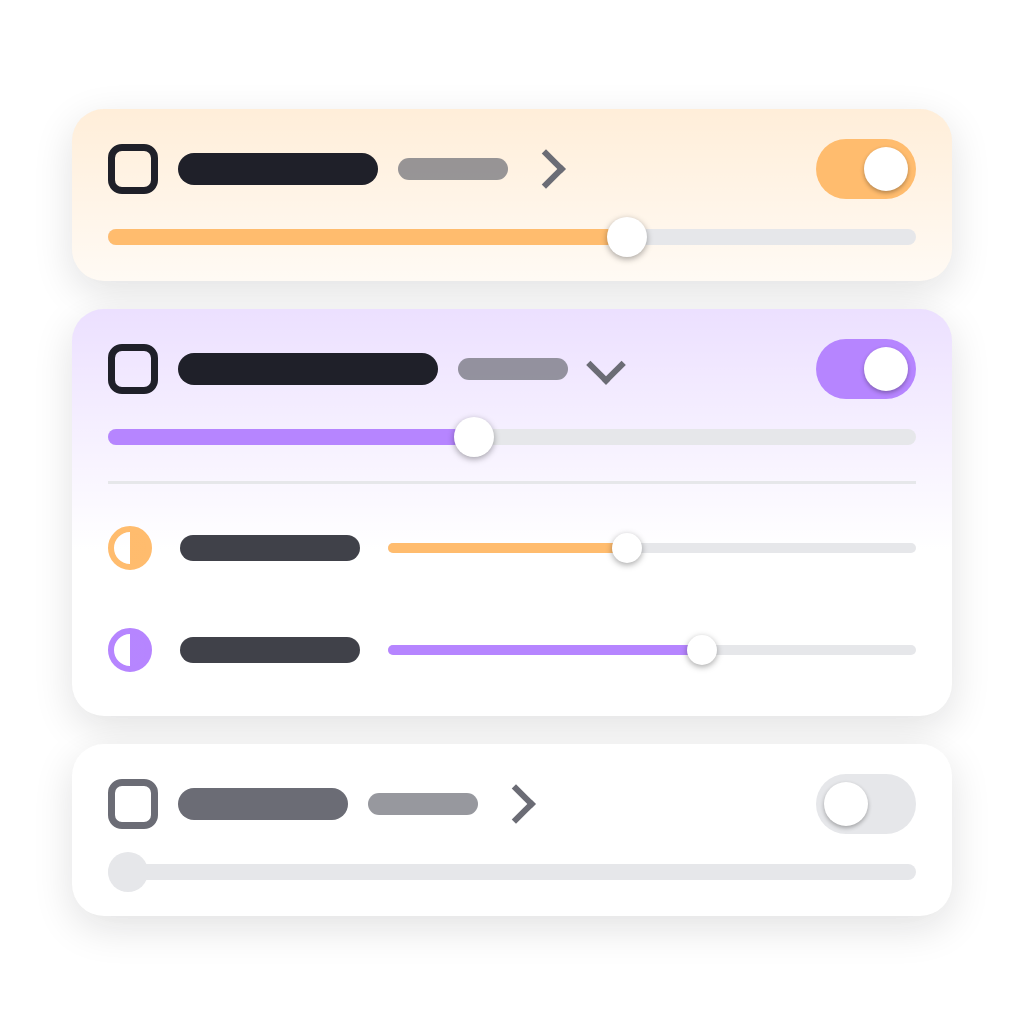
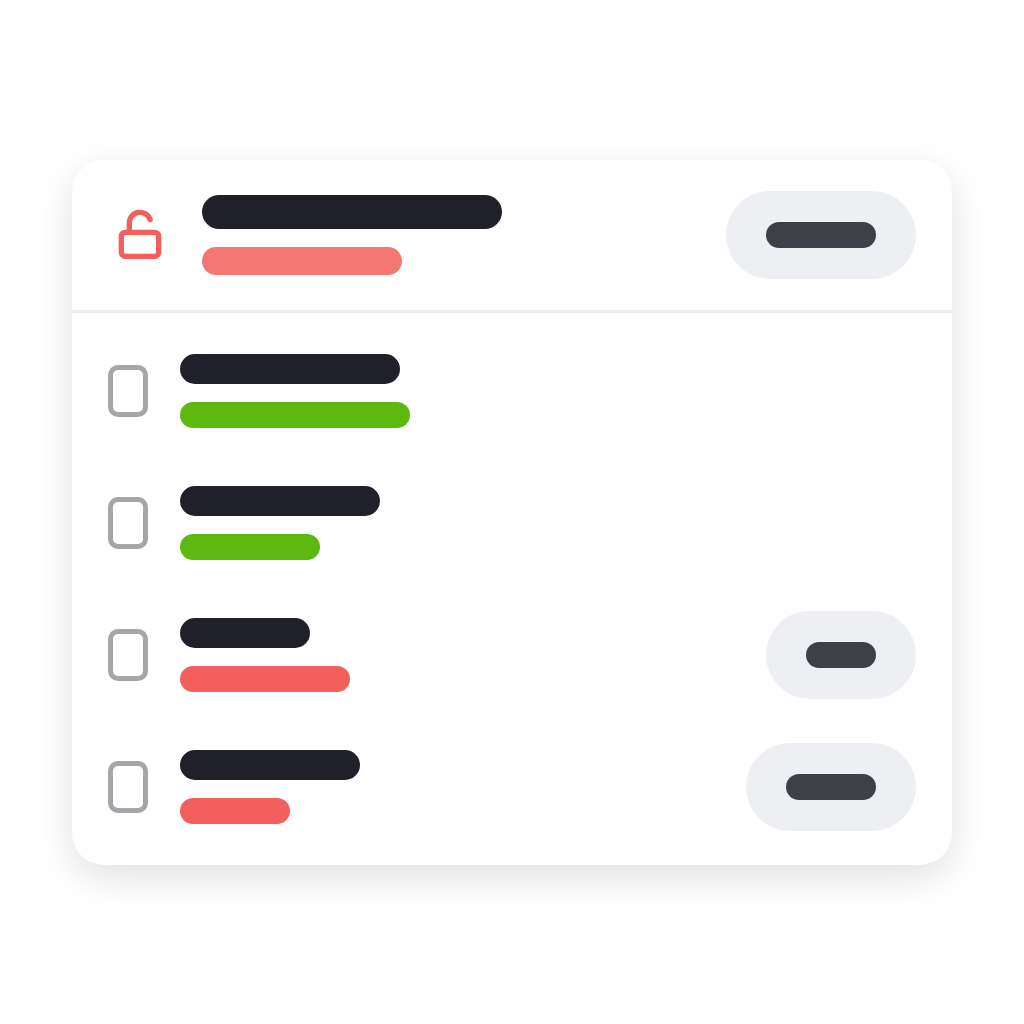
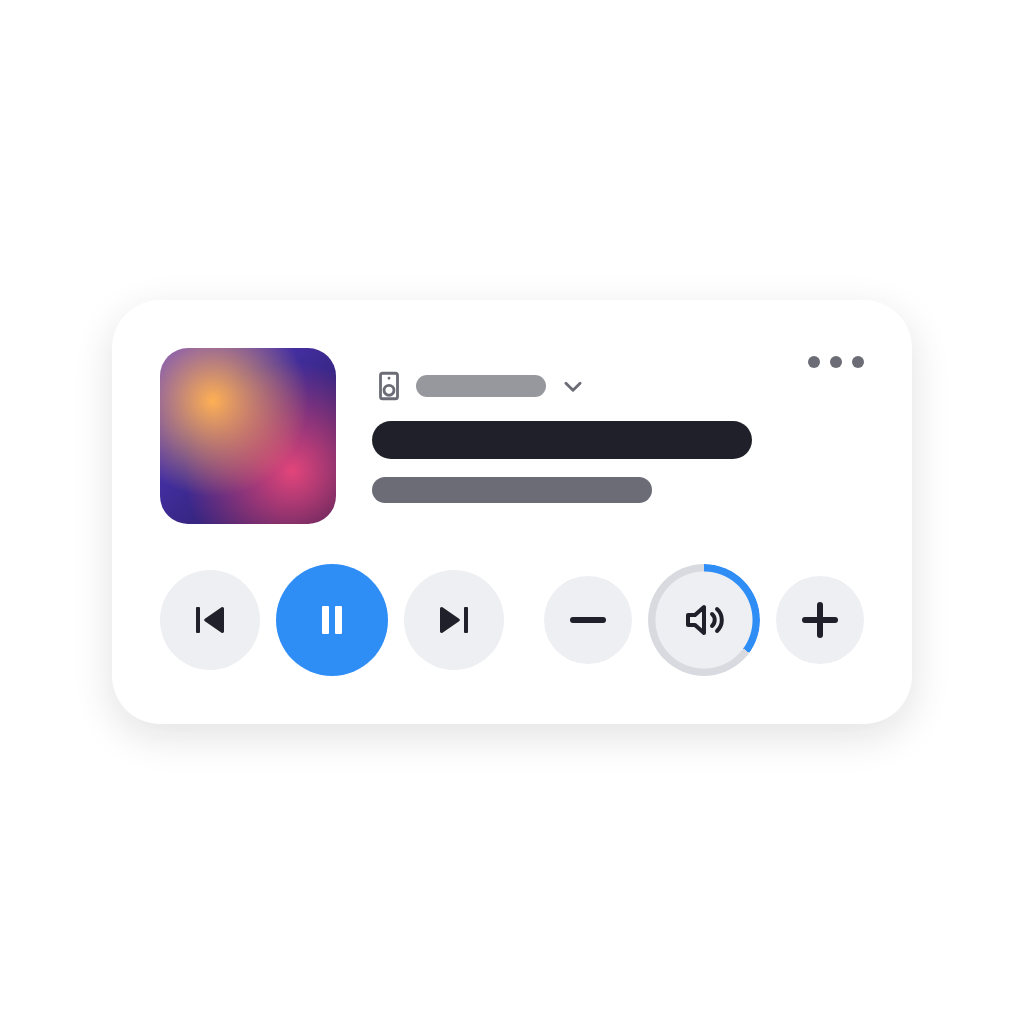
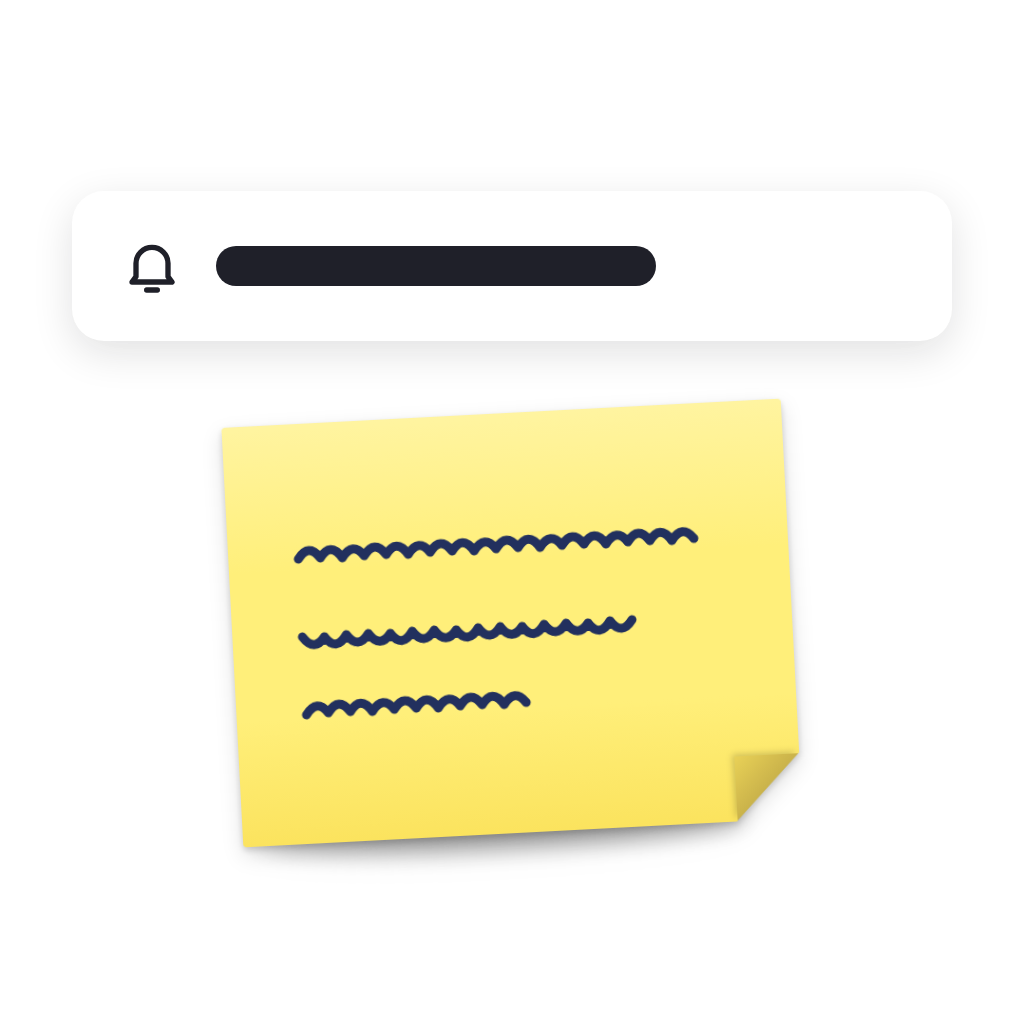
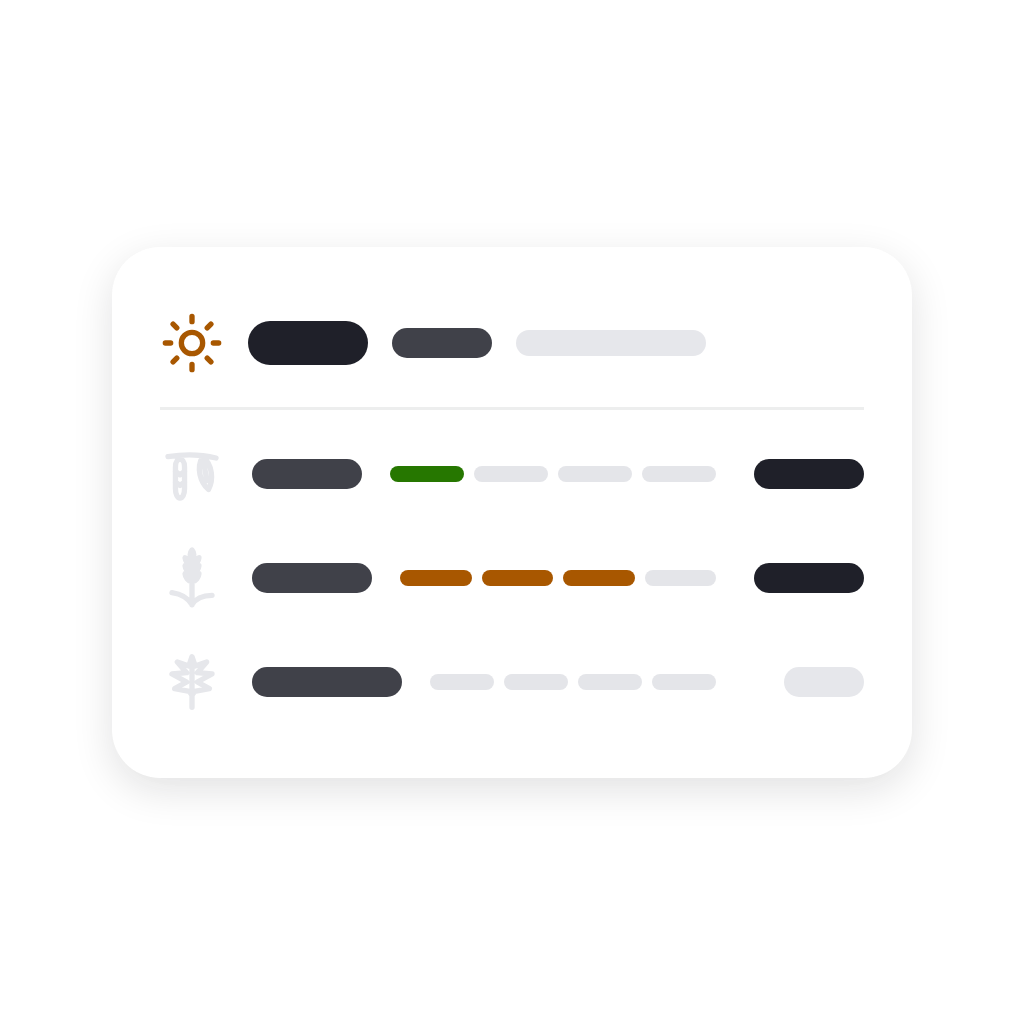
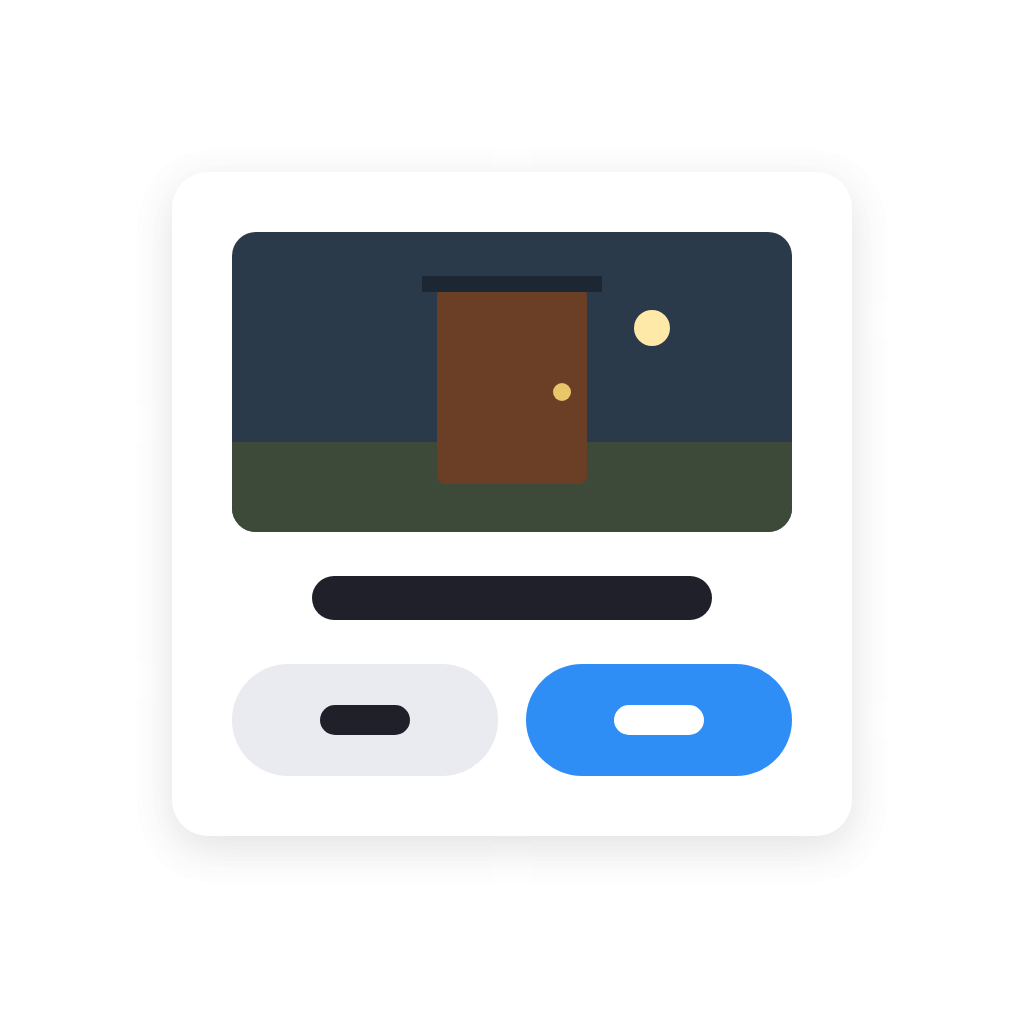
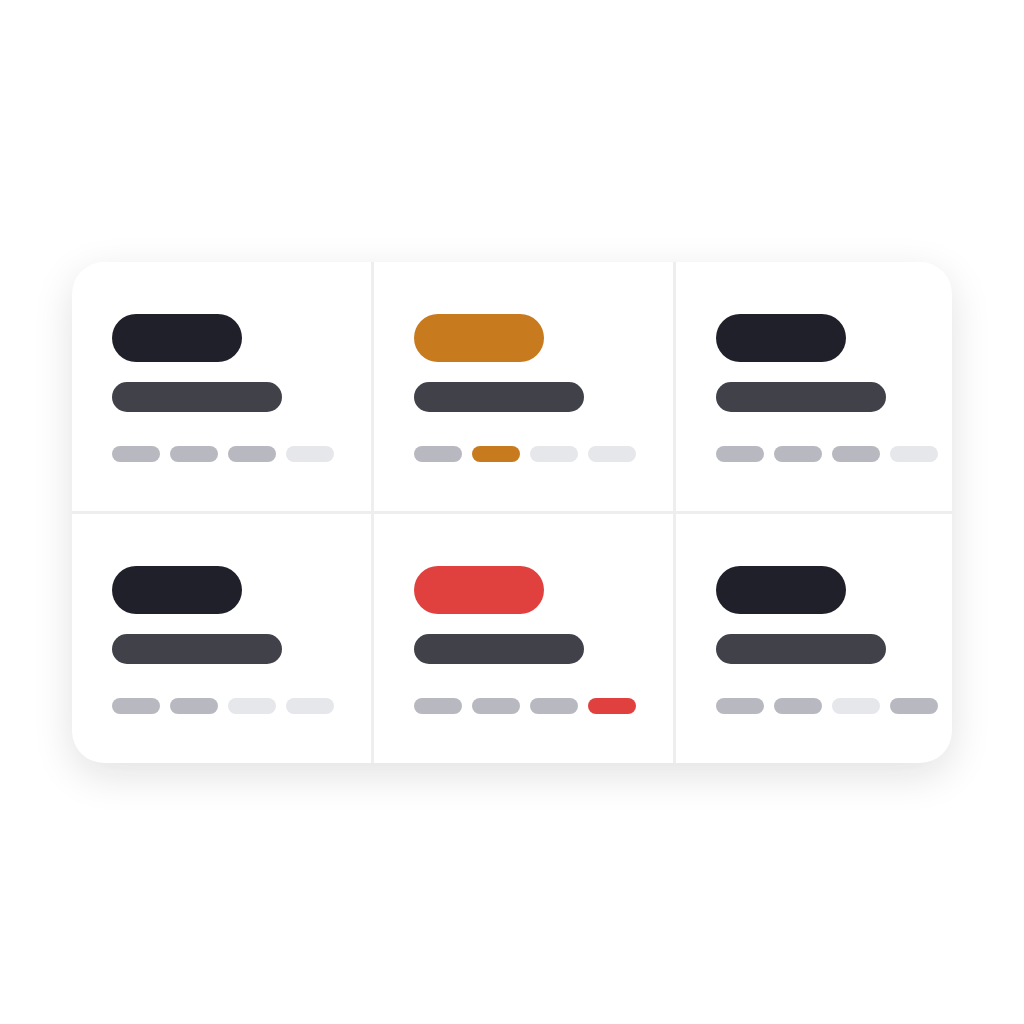
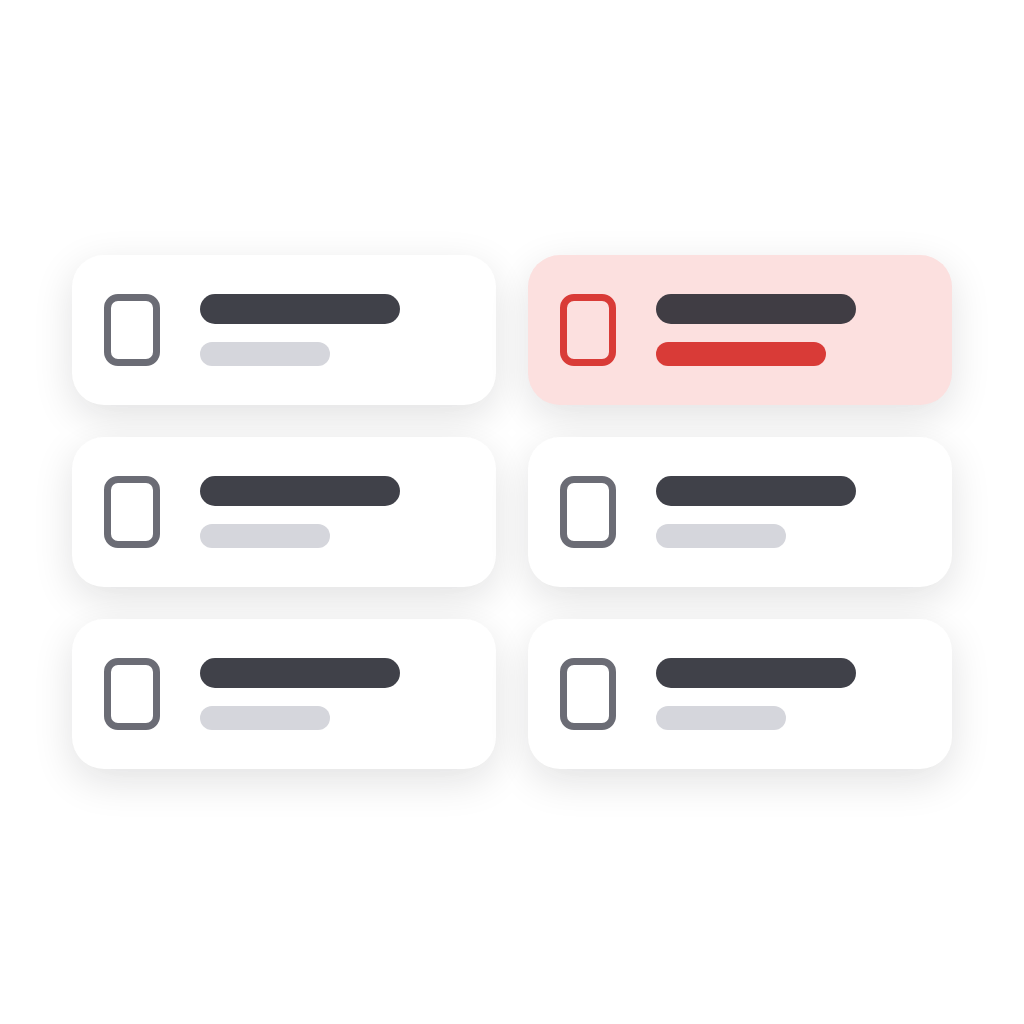
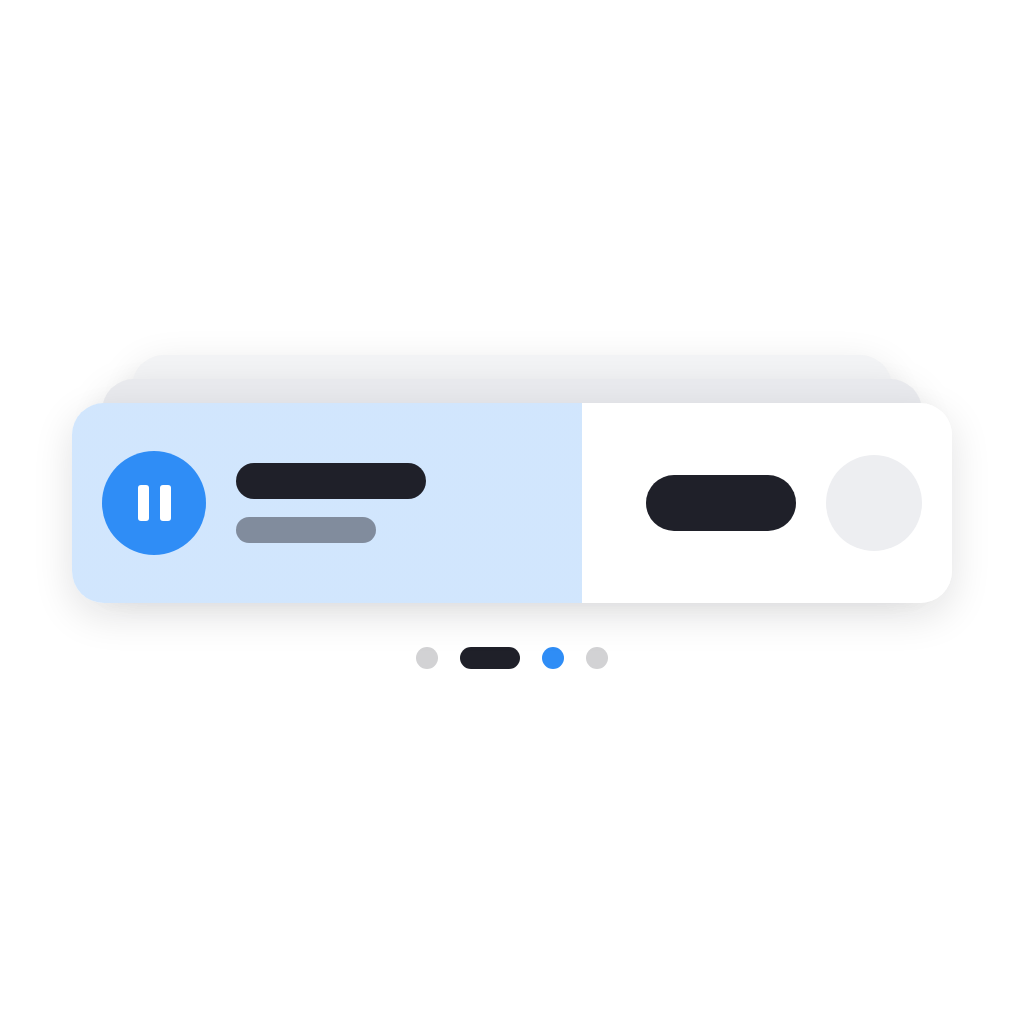
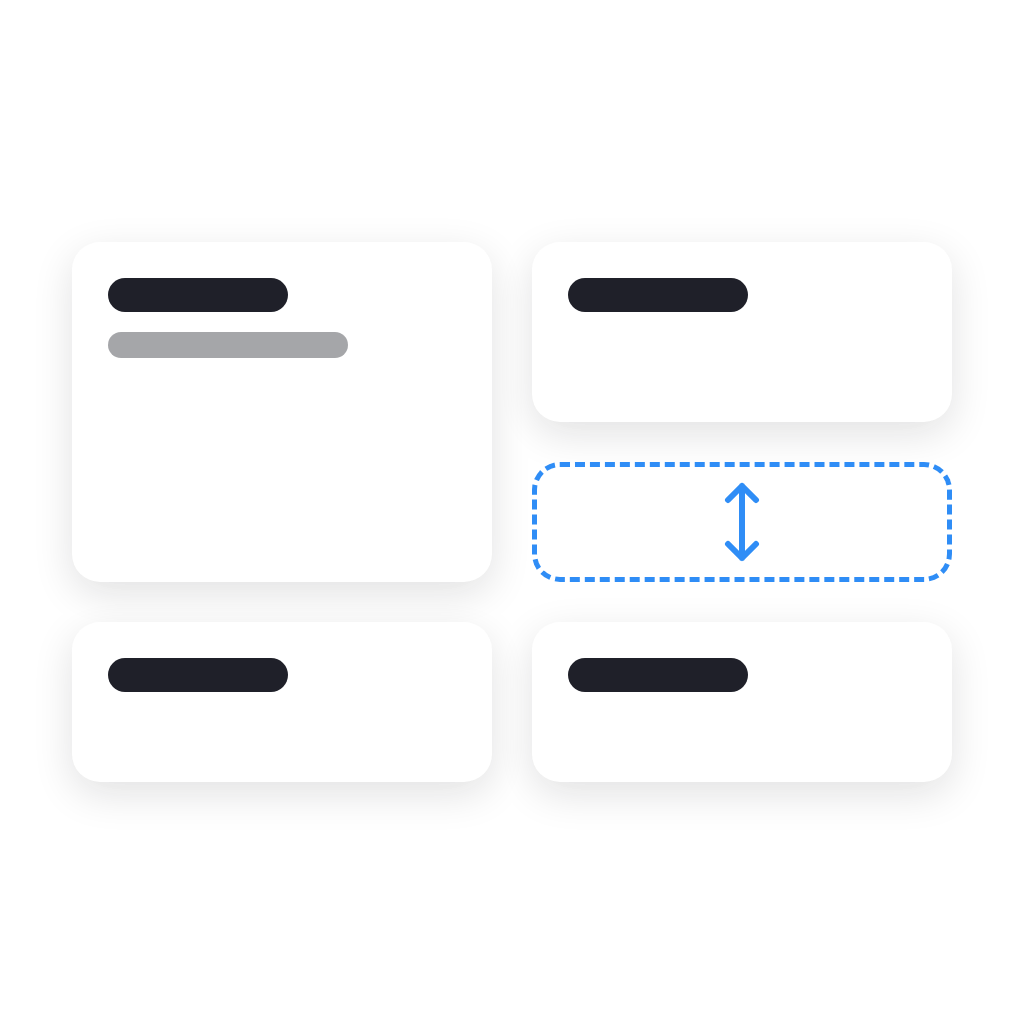
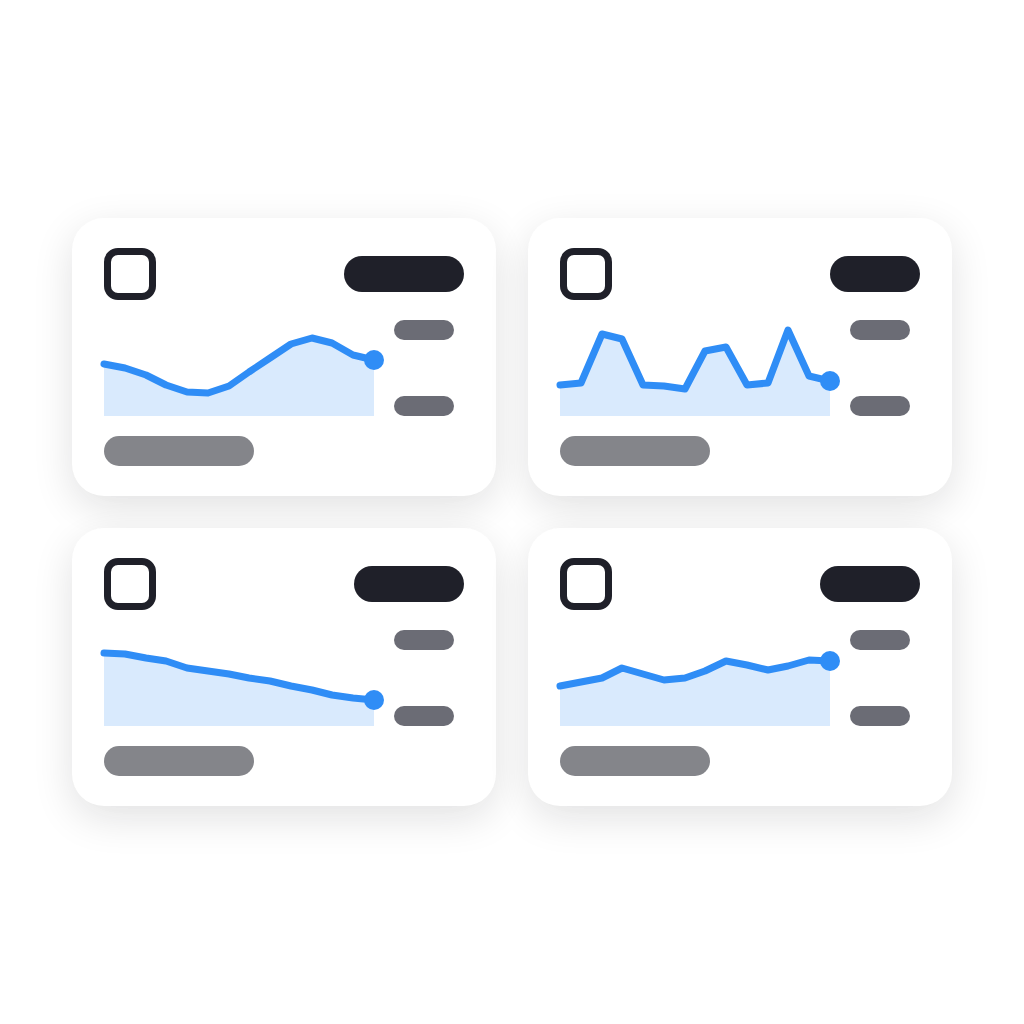
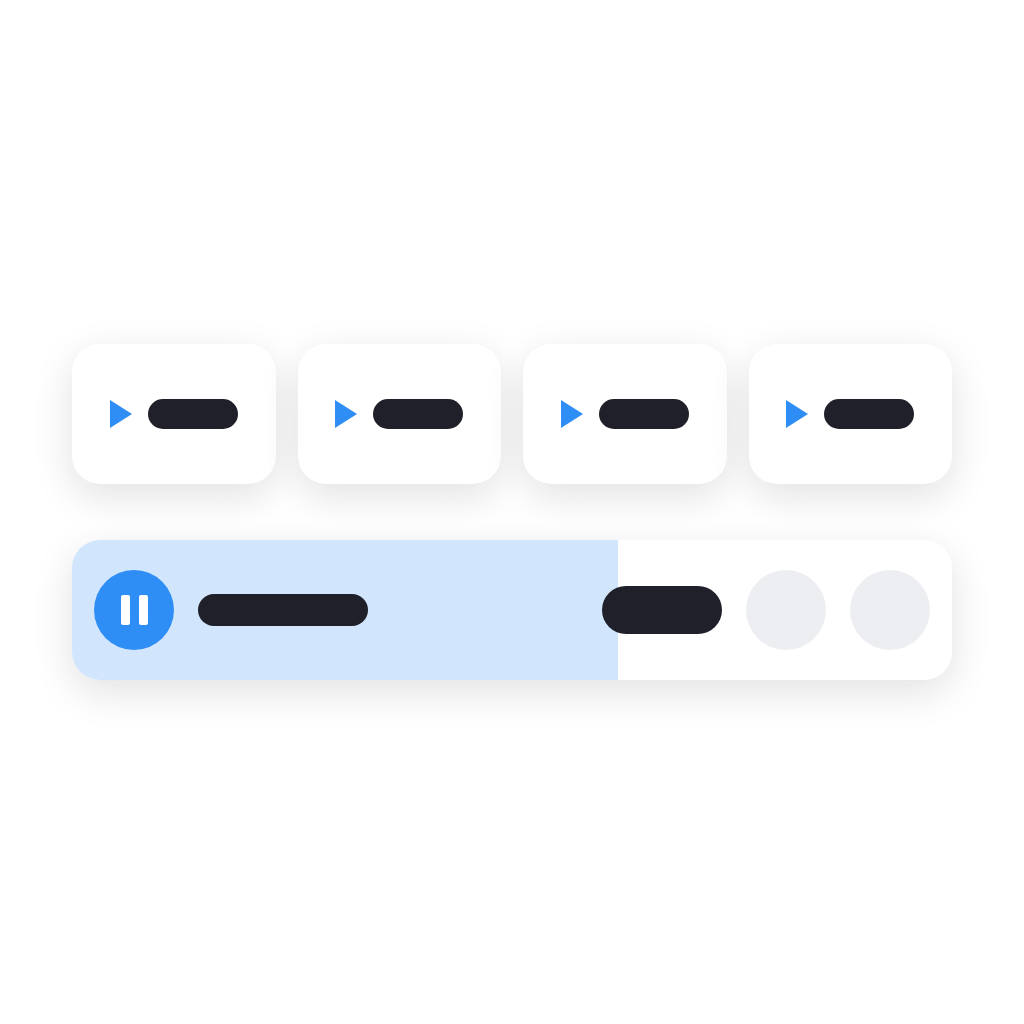
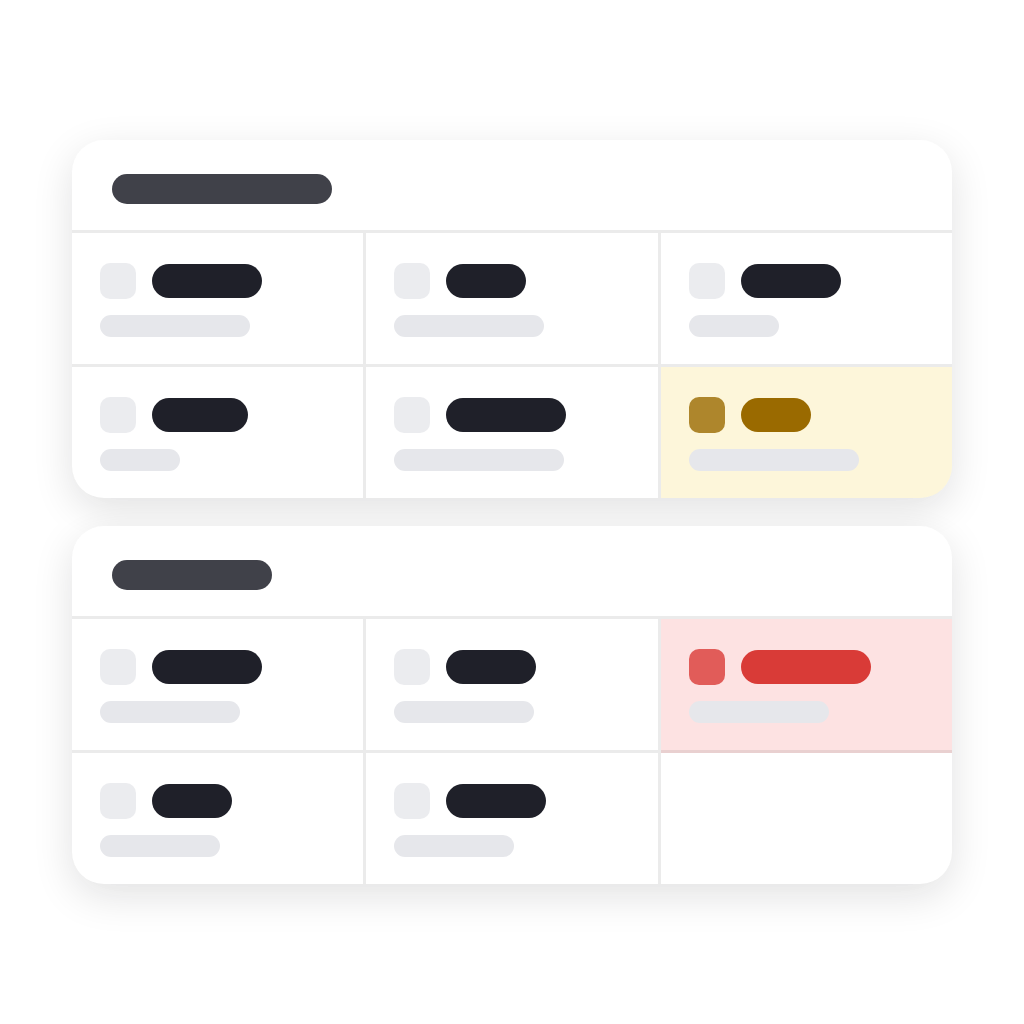
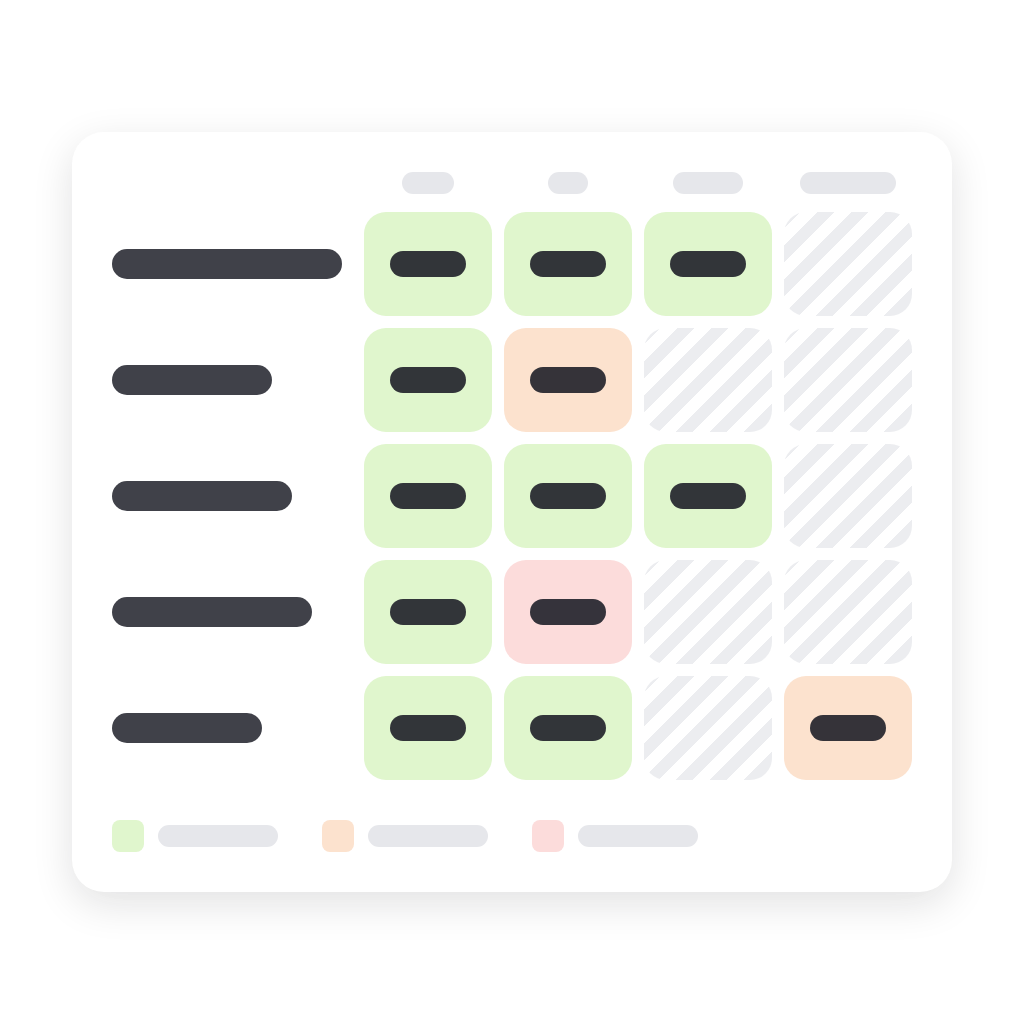
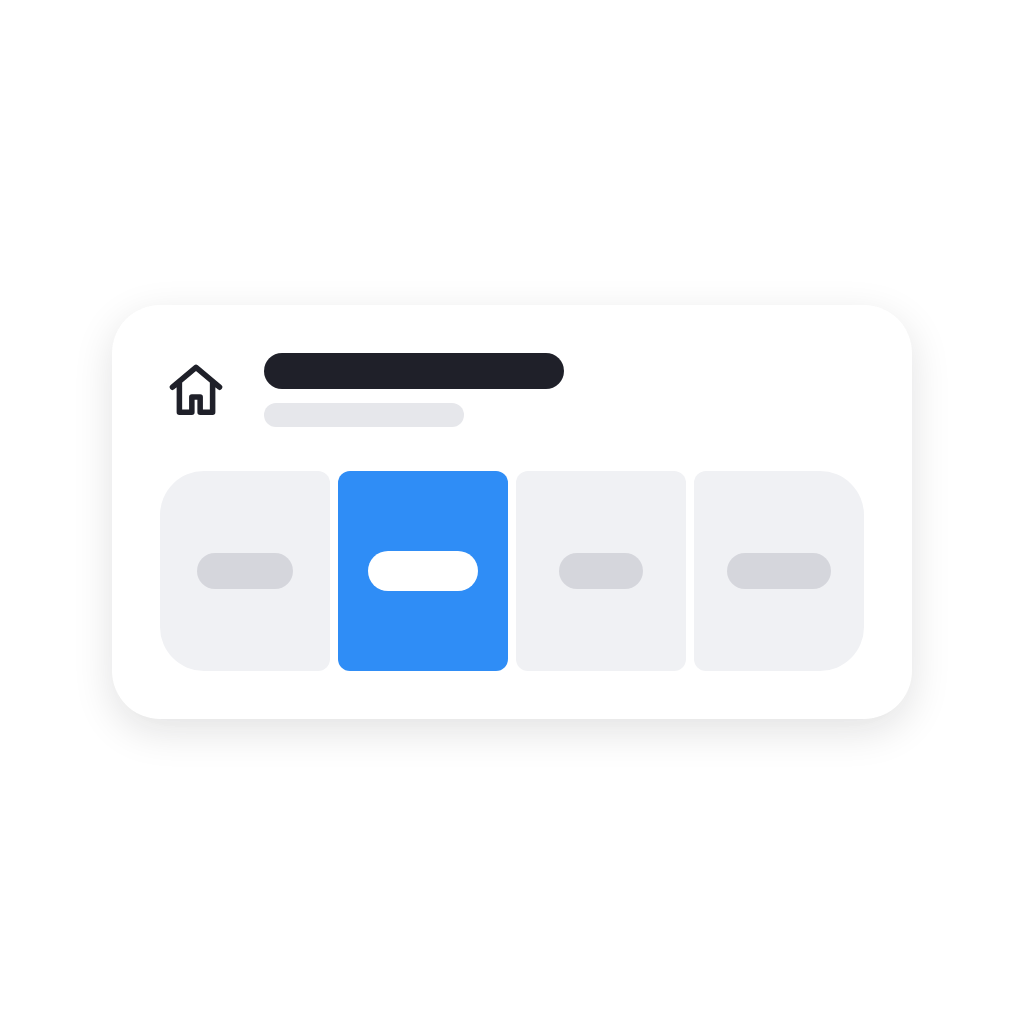
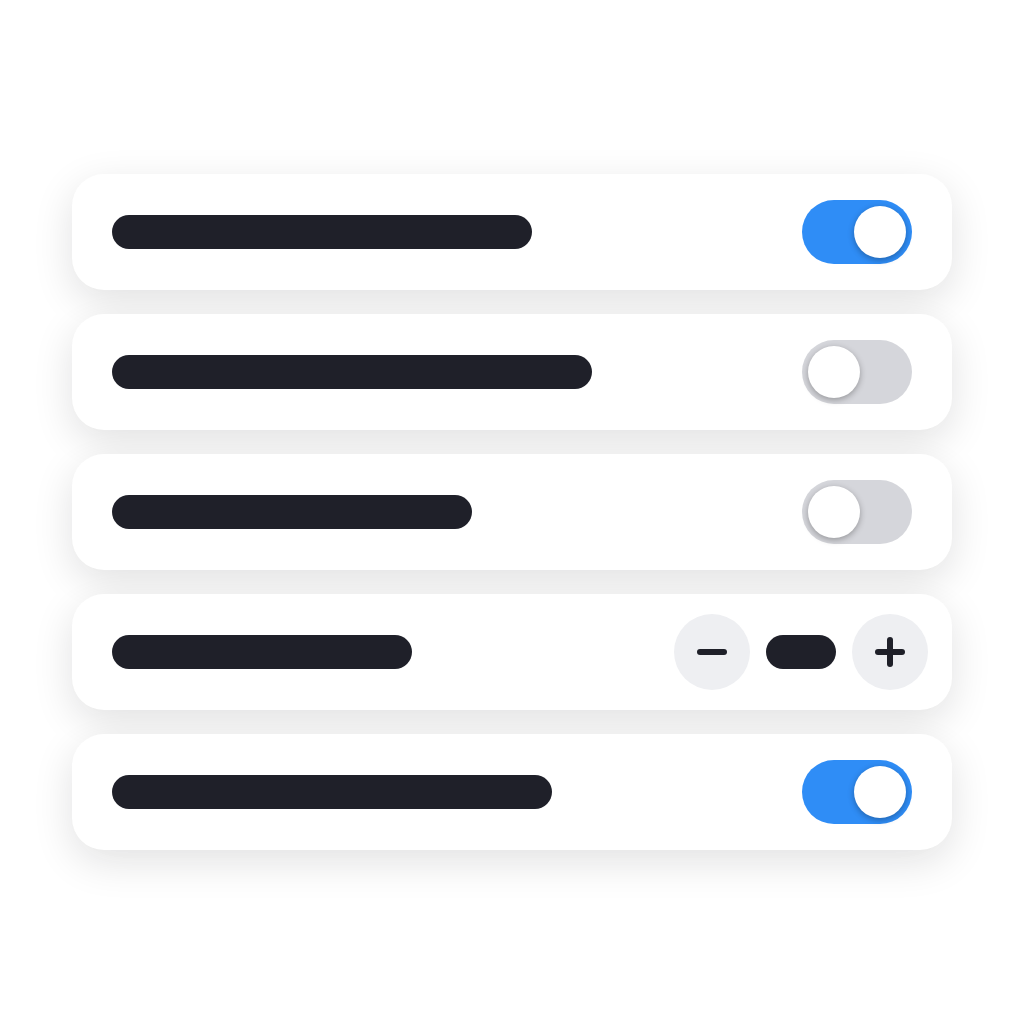
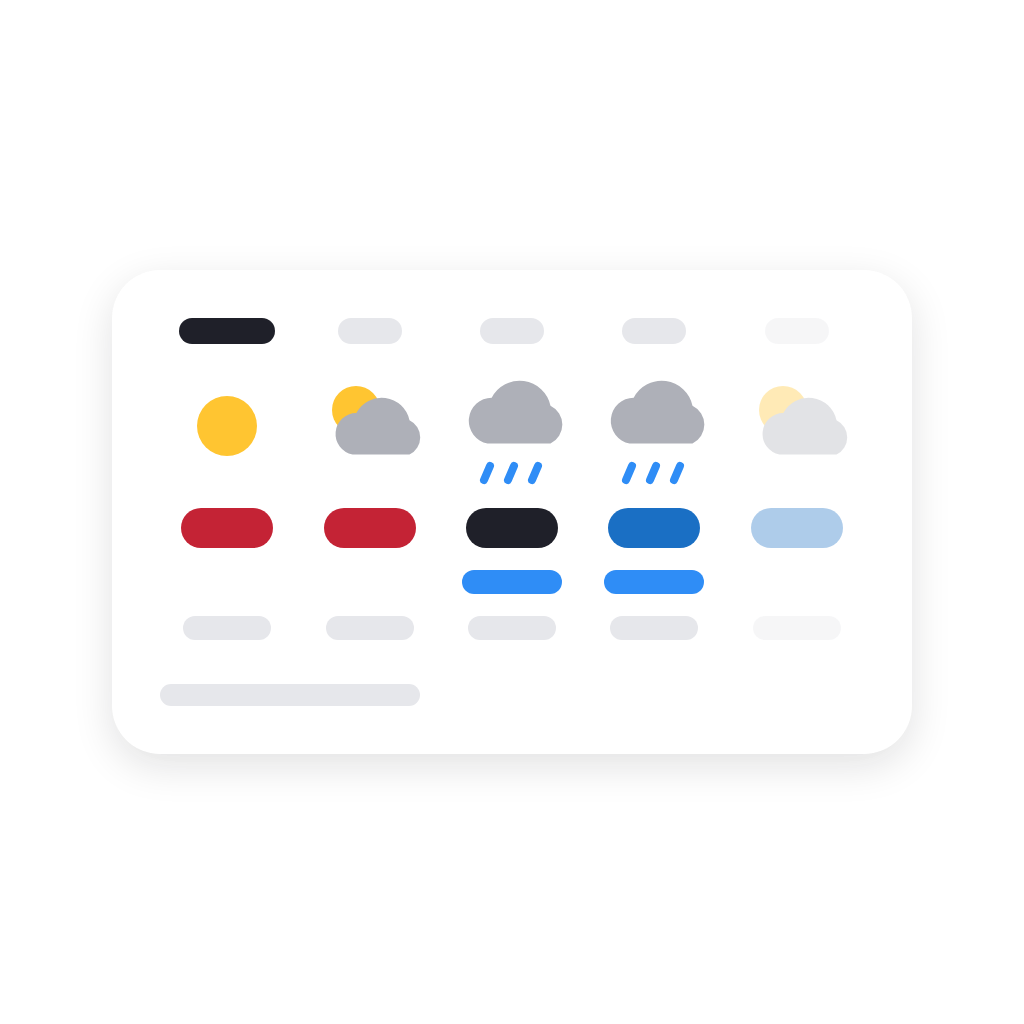
The widgets cover energy, with live power use, hourly electricity prices and a compact price strip; climate, with thermostat presets, a 36-hour weather forecast, heatmaps and small charts of any sensor value; security, with sensor alarms, motion and door sensors at a glance, cameras with live view, and locks and doors; and everyday control, with quick actions, light controls with colours, curtains with one-tap open and close, a speaker card with mute, a volume limit and source buttons, device values, variables, preset buttons for a variable, flow buttons, kitchen timers and a clock with the date and the weather. Many of them are compact tiles, so more fits on a dashboard. A spacer lines widgets up across columns. Notes show a short message on a tile or a handwritten Post-it, typed in or written by your Flows. A Smart Stack shows several of them in one spot, one at a time, and brings forward the one that matters, such as the cameras when someone is at the door. Web dashboards show them in any browser on your home network, too. Ten chart widgets draw any Insights value: over any span up to two years, as totals per hour, day or month, against another value, against the usual day, as each day's low and high, ranked across devices, stacked, as lines, as an on/off timeline, or now on a bar or dial. Days Since counts the days since the plants were watered or the filter changed, turning amber, then red, when it's due. Room Health shows each room's temperature, humidity and air quality at a glance, turning yellow to red when something is off, such as a stuffy bedroom. Value Matrix puts devices or rooms against the values you choose in one table, each cell green, orange or red by its range. Web Page shows any web page, scaled to fill the widget, with buttons to switch between addresses. Pollen and UV shows today's pollen levels, from birch to ragweed, and when the UV index peaks, in Europe. Popups let a Flow show a message or ask Yes or No, with a doorbell's picture if you like, in front of everything on a web dashboard or on your phones and tablets. Lights by Room puts every room's lights on a card: switch and dim a whole room, or open it for each light's brightness and colour and the room's Moods. A Keypad puts up to three buttons behind an optional code, to arm an alarm, unlock a door or allow an hour of TV. Combined Value folds one value of several devices into one, such as the average temperature of every room, the house's total power or the lowest battery, with each device against the others on a small chart. Flow Tiles show what your Flows write on tiles, such as the bins, the car's range or an internet check, with an icon, a colour and a fill, and a tap can start a Flow. Value Board shows every value of the devices you pick in one widget, grouped by room or device, and a low battery or an open window stands out by itself.
Weather data from MET Norway, licensed under CC BY 4.0.
Pollen and UV data from Open-Meteo, licensed under CC BY 4.0, generated using Copernicus Atmosphere Monitoring Service information.
Read more ›