




Graph Widgets
Bar-chart widgets for your Homey dashboard: energy, water, distance and temperature history from Insights.
경고! 이 앱이 제대로 작동하지 않을 수 있습니다.
이 앱 버전은 현재 테스트 중이며 아직 검토되지 않았습니다. 기대한 대로 작동하지 않을 수 있습니다.
이 앱을 설치할 때는 각별히 주의하세요.
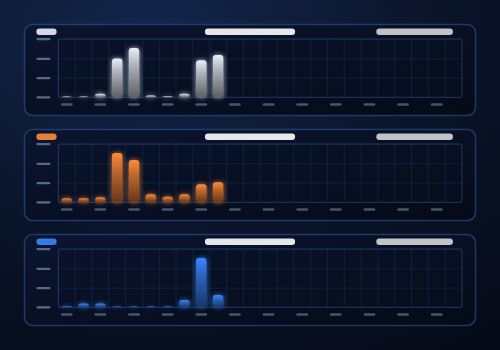
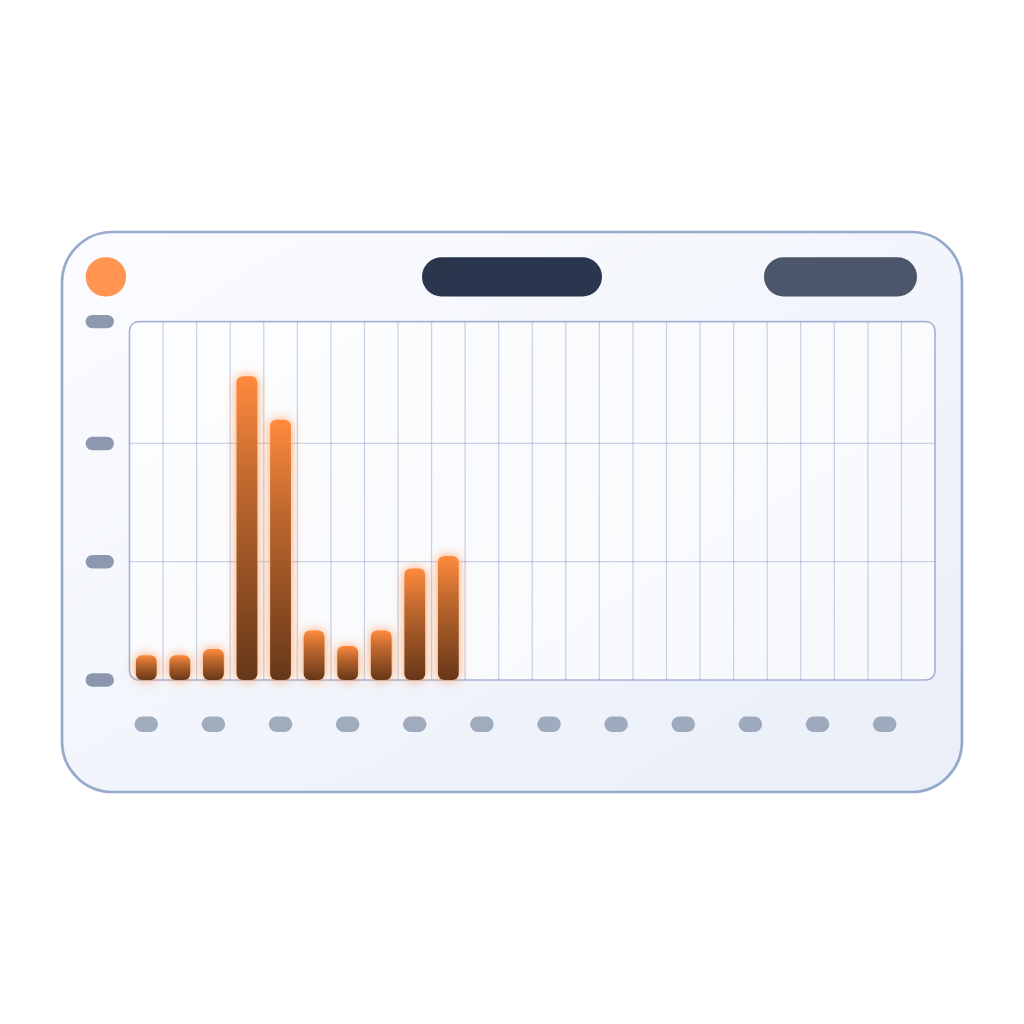
Graph Widgets adds a bar-chart widget to your Homey dashboard. Pick any quantity that Homey records in Insights and see its history at a glance: energy, water, distance and temperature.
HOW TO USE
1. Edit a dashboard and add the "Graph" widget from Graph Widgets.
2. In the widget settings choose the Insights metric (search by device, app or metric), a color and the default period.
3. Optionally set your own chart title and show the period switcher.
PERIODS
- Day: one bar per hour
- Month: one bar per day
- Year: one bar per month
- All: one bar per year
A small badge in the corner shows the total for the shown period (an average for temperature and flow rates).
WHAT YOU CAN CHART
- Energy: kWh and Wh meters, including daily counters such as "Solar Today"
- Water: liters and flow in l/min
- Distance: odometer and mileage in km
- Temperature: hourly, daily and monthly averages, negative values included
Counters are shown as the consumption in each period, so a meter that only grows still gives you a useful bar chart. You can use several widgets with different metrics and colors on one dashboard.
PRIVACY AND PERMISSIONS
The app only reads data on your own Homey: Insights logs, plus device and app names so metrics can be listed with a readable name. Nothing is sent outside your Homey and nothing is written or controlled.
SUPPORT
Questions and bug reports: please post them in the Homey Community Forum topic of this app.
If you like the app, you can support its development with a donation via the link on the app page.
위젯
지원
이 앱에 문제가 있습니까? 개발자에게 문의하려면 여기를 클릭하세요..
새로운 기능
버전 1.0.1 — App improvements.
Graph Widgets
 이 앱으로 Homey 전체를 관리할 수 있습니다.
선택하신 Homey에 Graph Widgets이(가) 호환되지 않습니다.
 Graph Widgets이(가) 곧 Homey에 설치됩니다.
업데이트 로그

Africa


Asia


Europe

 Belgium
Deutsch English
 Bulgaria
 Croatia
 Cyprus
 Czech Republic

 Estonia
 Finland


 Greece

 Hungary
 Iceland
 Ireland

 Latvia
 Lithuania

 Malta
 Moldova
 The Netherlands


 Portugal
 Romania
 Slovakia
 Slovenia


 Türkiye
 Ukraine
 United Kingdom


