





Energy Dashboard
Shower started
경고! 이 앱이 제대로 작동하지 않을 수 있습니다.
이 앱 버전은 현재 테스트 중이며 아직 검토되지 않았습니다. 기대한 대로 작동하지 않을 수 있습니다.
이 앱을 설치할 때는 각별히 주의하세요.
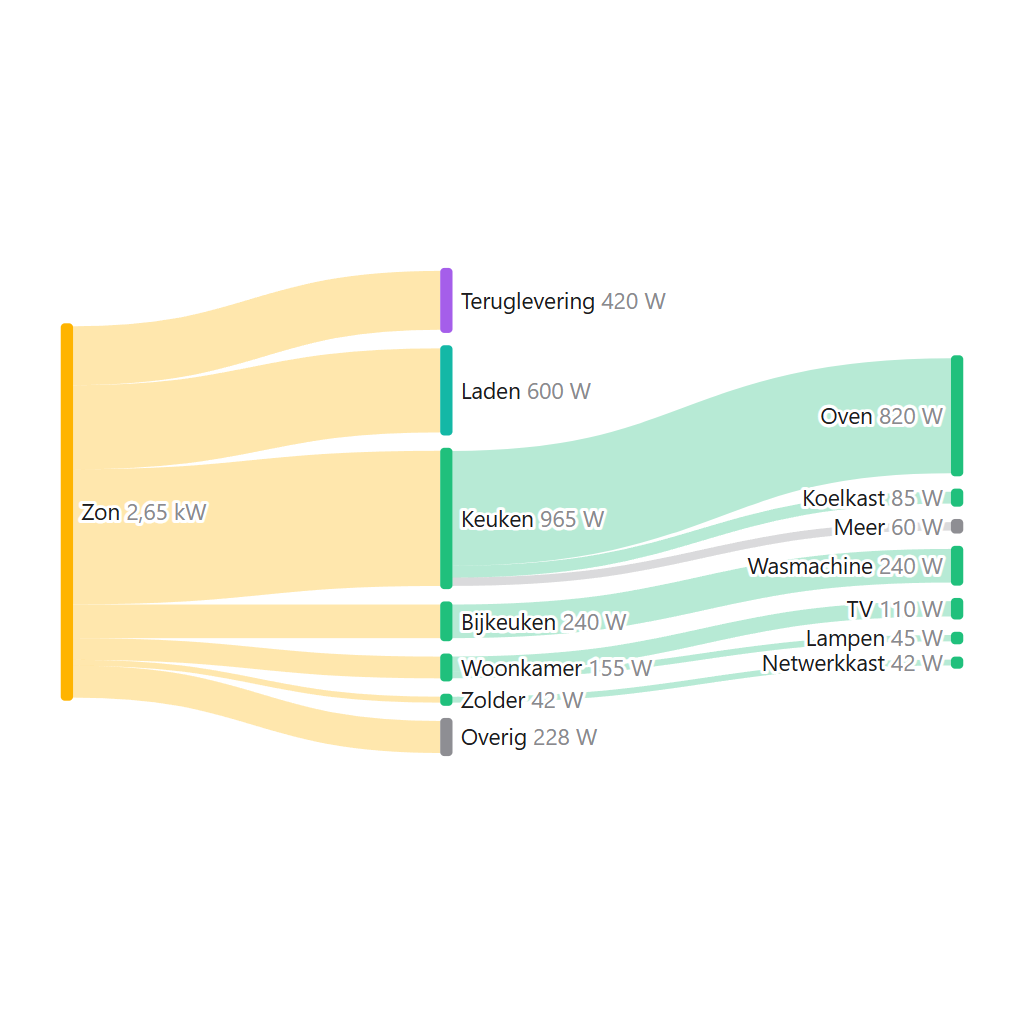
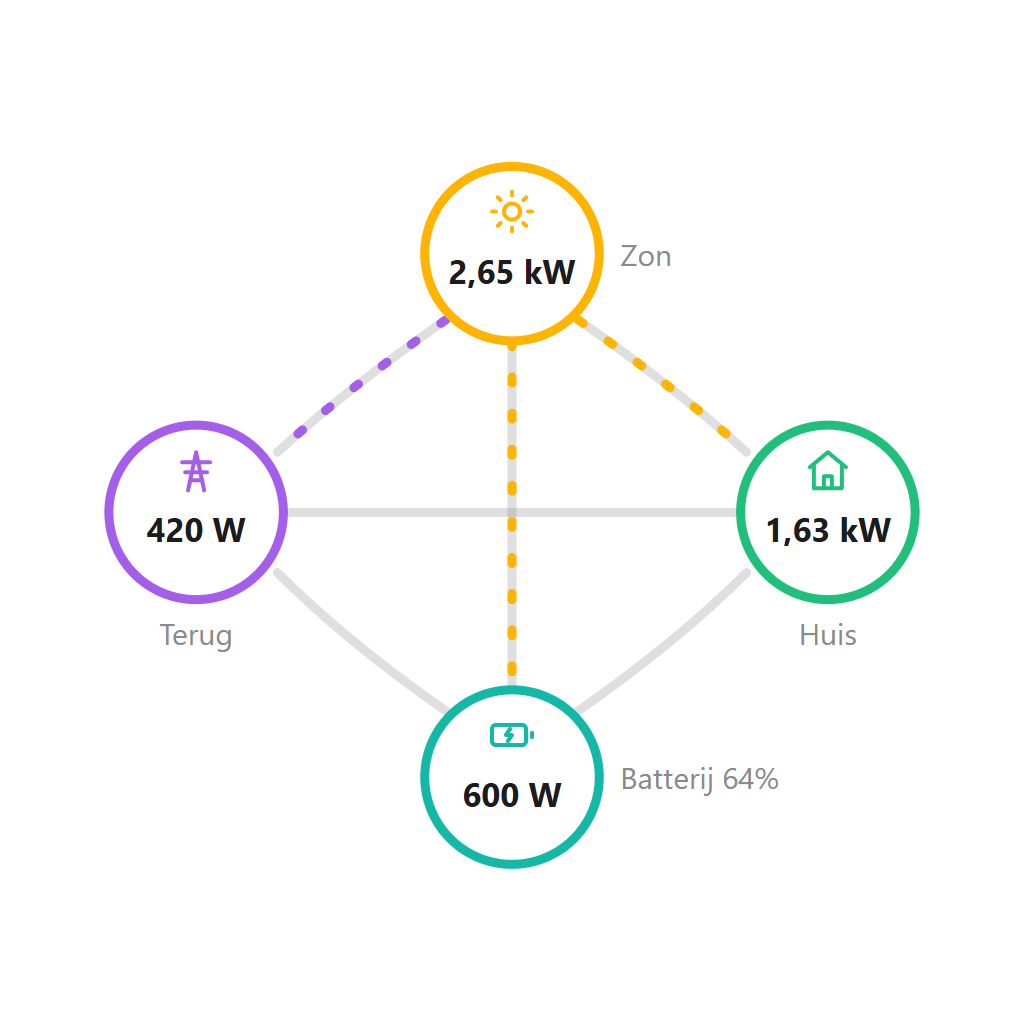
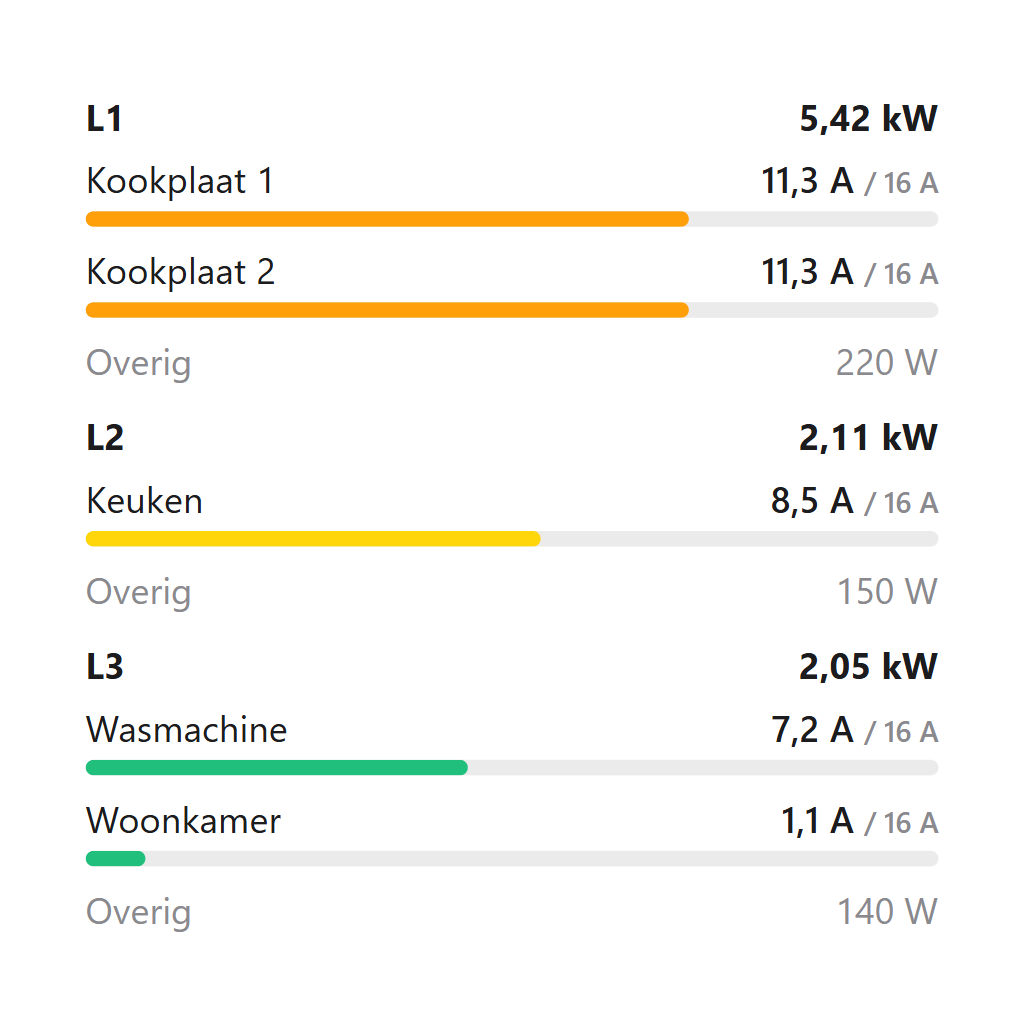
이 앱에 문제가 있습니까? 개발자에게 문의하려면 여기를 클릭하세요..
버전 0.2.34 — New block Grid CO2: how clean the electricity of the grid is now, the forecast for today and the cleanest 3 hours, from Energy-Charts. With a dynamic gas contract the gas price of today shows in the Electricity price block. New tags: grid CO2 and gas price.
 이 앱으로 Homey 전체를 관리할 수 있습니다.
선택하신 Homey에 Energy Dashboard이(가) 호환되지 않습니다.
 Energy Dashboard이(가) 곧 Homey에 설치됩니다.
Dr Peppers 님께 앱을 잘 사용하고 있다고 알려주세요.
제안을 보내주셨다고 Dr Peppers 님에게 알리겠습니다.
 Belgium
 Bulgaria
 Croatia
 Cyprus
 Czech Republic
 Estonia
 Finland
 Greece
 Hungary
 Iceland
 Ireland
 Latvia
 Lithuania
 Malta
Malta
 Moldova
 The Netherlands
 Portugal
 Romania
 Slovakia
 Slovenia
 Türkiye
 Ukraine
 United Kingdom


