


Measuring Solar Panel Output With the P1 Port
To truly master your solar energy, you need to see exactly how power moves through your home. The P1 port on your smart meter acts as the ultimate sensor, capturing the live balance between what you produce and what you consume.
By connecting this data to Homey, you gain the clarity needed to stop guessing and start automating. It turns raw numbers into a clear map of your energy habits, allowing you to run your home on your own terms.
The Smart Meter as a Window Into Your Solar Power
Many people know their smart meter mainly as the little box the grid operator uses to read energy consumption remotely. But for anyone with solar panels, the smart meter is much more than that: it is the central point where all energy flows come together.
Via the P1 port you can read that information and see in real time what is going through your cables. Measuring solar panel output with the P1 port then doesn’t just mean looking at how much you have fed back in total, but actually understanding live what is happening right now.
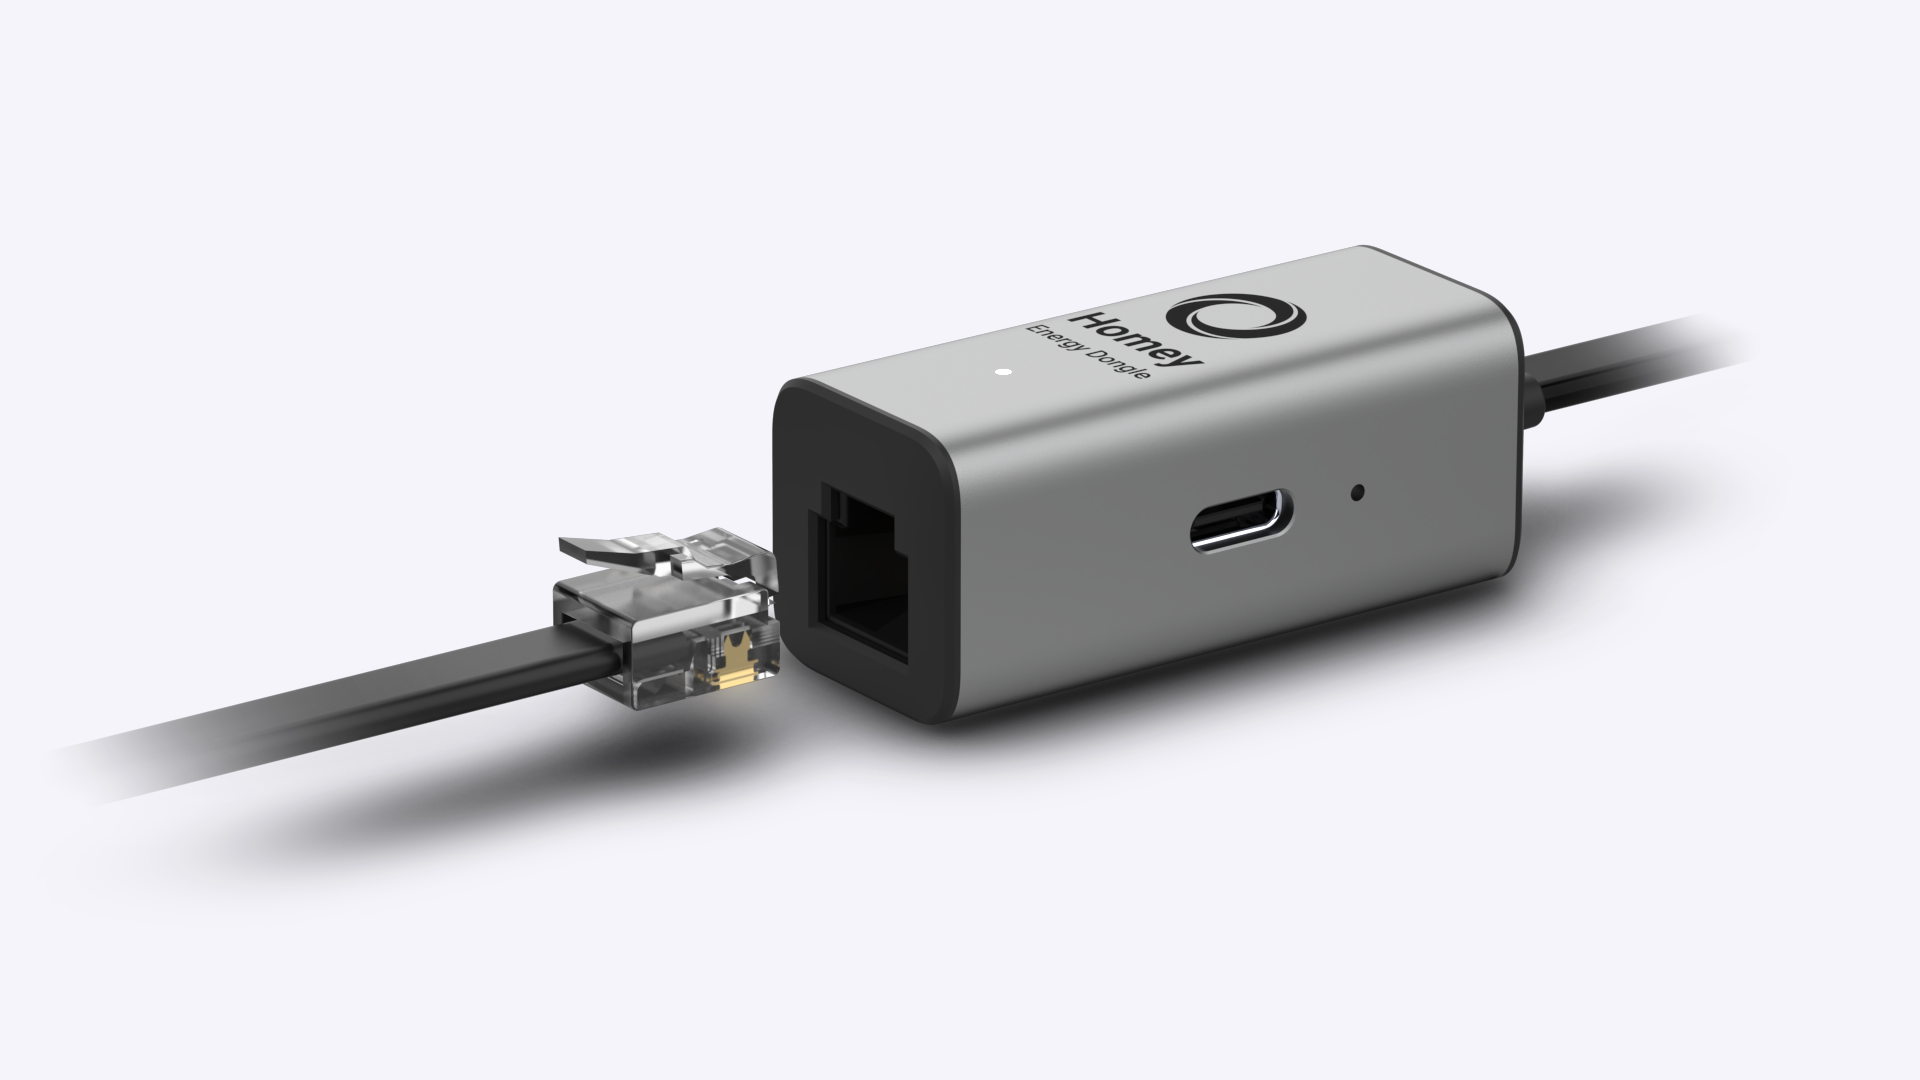
The P1 port sends out data about your consumption and feed-in, often every second or every few seconds. If you connect a device to it that can talk to Homey, such as the Homey P1 Energy Dongle, that data flows straight into Homey. Suddenly you see how many watts your home is drawing from the grid, how many watts are being fed back, and how that fluctuates throughout the day.
If you also connect your inverter to Homey, you get a particularly powerful duo. The inverter tells you how much your panels are generating, the P1 port tells you how much of that you are using yourself and how much you send on to the grid. Gaining insight into energy consumption via the P1 port then becomes the key to real self-consumption: you see when it’s worthwhile to switch devices on and when it isn’t.
From Raw Readings to Useful Insights
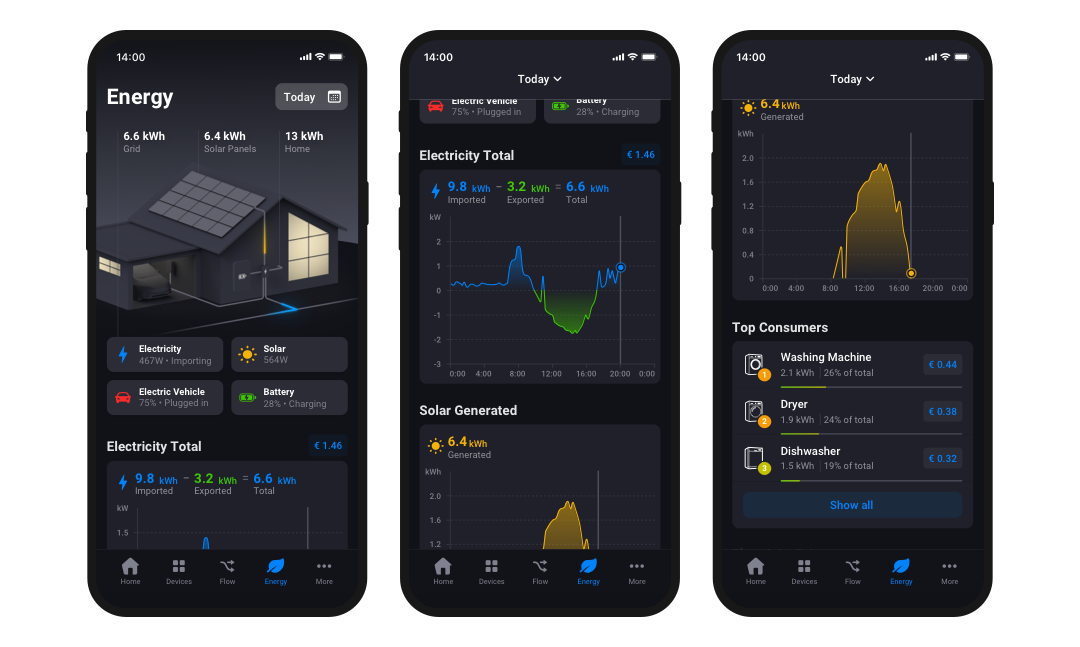
Raw data on its own isn’t that interesting or useful. It only becomes valuable when you start recognizing patterns. By watching the graphs in Homey Energy for a while, you get to know your home in a new way. You see the morning peak when everyone is showering and devices switch on, the quiet midday hours when the house is empty, and the evening wave when the lights go on and cooking starts.
If you combine that with sunny days, an interesting insight appears: you see when your panels are producing a lot, and how that production peak relates to your consumption profile. You might notice that you routinely feed in a lot around midday, while your real consumption peak is later in the evening. Those are exactly the moments where automation can make a huge difference.
Monitoring solar panels with Homey Energy via the P1 port also lets you detect “mistakes”. For example, if on a clear day you suddenly see your feed-in collapse while you are not changing anything, that can be a sign your inverter has shut down or there is a fault in the system. Instead of only noticing that months later on your annual bill, you can act much more quickly.
Automation Based on P1 Data
P1 data is ideal as a trigger for Flows. Instead of saying “if the sun is shining, do X”, you can work much more precisely: “if export to the grid is higher than 1,500 watts, the dishwasher may start.” You then automate based on what is actually going through the meter, not just on what your panels are producing.
That way you can build smart automation for self-consumption of solar power without necessarily having to know the technical details of your inverter. The P1 port already tells you exactly what is happening. If you want to go further, you can combine P1 data with specific device measurements to analyze energy consumption per day and per device. Then you’ll see not only that you’re using 500 watts extra, but also which device is responsible.
With the P1 port as an information source, it also becomes easier to experiment. Switch a device off temporarily and watch what happens in Homey. The live graph in Homey Energy shows you almost immediately what the effect is. In this way, energy awareness becomes something practical and tangible, not just an abstract good intention.
FAQ
Do I need a P1 dongle if I already connected my inverter?
Strictly speaking, no, but the combination of both gives a much more complete picture. The inverter tells you what your panels produce, the P1 port tells you what goes via the grid. Together they show how much you use yourself and how much you feed back. For anyone who really wants to optimize self-consumption, that combination is very valuable.
Can I see how much my solar panels produce using only the P1 port?
Indirectly yes, but not exactly. At sunny moments you can infer from the feed-in that your panels are producing more than you consume. If you want to know precisely what the panels themselves generate, a direct connection to the inverter is better. At the same time, the P1 port remains essential to see what happens with that power.
How accurate are measurements via the P1 port?
The P1 port reads the same data that is used for your official meter readings. That makes the measurements reliable enough for both insight and control. For very detailed analysis per circuit or per device you need additional measuring points, but for the overall picture the P1 port is a solid foundation.
Does the P1 port work with every smart meter in the Netherlands?
Almost all modern smart meters in the Netherlands have a P1 port that uses a standard protocol. Most P1 dongles and integrations, including those for Homey, support that standard. Your meter’s manual shows whether and how the P1 port is available.
Does the P1 dongle need to stay connected all the time?
Yes, if you want continuous insight. The dongle uses little power and sends data to Homey constantly. It’s precisely that continuity that lets you see patterns and keeps automations running smoothly. Disconnecting it temporarily is technically possible, but it removes a large part of the system’s power.
Is it safe to use a P1 dongle?
The P1 port gives access to your consumption data, not to adjusting meter readings or the measurement itself. The dongle only reads information. The connection with Homey works like with other smart home devices. Do make sure you use reliable hardware.
Can I also use P1 data to track my gas consumption?
Yes, most smart meters also send gas meter readings via the P1 port. You can use that data in Homey to get a complete picture of your energy use, both electricity and gas. That is especially interesting in transition situations with, for example, a hybrid heat pump.
Does the P1 port also help with dynamic energy contracts?
Indirectly, yes. Although the P1 port itself doesn’t transmit prices, by combining P1 data with price information in Homey you can see exactly how much you use in expensive or cheap hours. That makes it easier to build Flows that shift your usage to favourable moments.
Can I get notifications when feed-in rises above or falls below a certain value?
Yes, that’s a typical Homey use case. You can create a Flow that sends you a push notification when export exceeds a specific threshold, or when you suddenly feed nothing back while it’s sunny. That way you stay informed easily without constantly checking graphs.10. Does the P1 connection keep working if my internet goes down?
Does the P1 connection keep working if my internet goes down?
The P1 dongle keeps measuring, but how data is sent to Homey depends on your setup. With a local Homey Pro, much functionality continues to work, especially if the connection is local. Cloud features may be temporarily limited. When the connection returns, the data stream continues.
Glossary
P1 protocol
The standard used by smart meters in the Netherlands and other European countries to send consumption data via the P1 port to connected equipment.
Real-time measurement
Being able to see the current situation almost instantly, such as your current consumption or feed-in, without hours or days of delay.
Grid import
The amount of electricity you draw from the public grid at a given moment.
Grid export
The amount of electricity you feed into the public grid at a given moment.
Measurement interval
The time between two consecutive measurements; for P1 data this is often seconds or a few seconds.
Data resolution
The level of detail in your measurements, for example per second, per minute or per quarter hour, which determines how finely you can control.
Load profile
The characteristic pattern of your electricity consumption and generation over a day, week or season.
Fault detection
Recognising from measurements that something is wrong, for example a failed inverter or an unexpected consumption spike.
Energy analysis
The process of using consumption and generation data to identify patterns, find causes and implement improvements.
